Microsoft Sentinel and a Honeypot That Got Hit 50 Times in Under an Hour
Connecting Microsoft Sentinel to the slytech.us hybrid environment, building custom detection rules mapped to MITRE ATT&CK, deploying a deliberately exposed honeypot VM, and watching real global attack traffic roll in.
This project connects Microsoft Sentinel to the existing slytech.us environment, builds detection rules against real identity data, and deploys a honeypot VM with RDP intentionally exposed to see what shows up.
It builds on the hybrid identity, endpoint management, and governance work from the previous three posts.
Eight Connectors, Zero Configuration
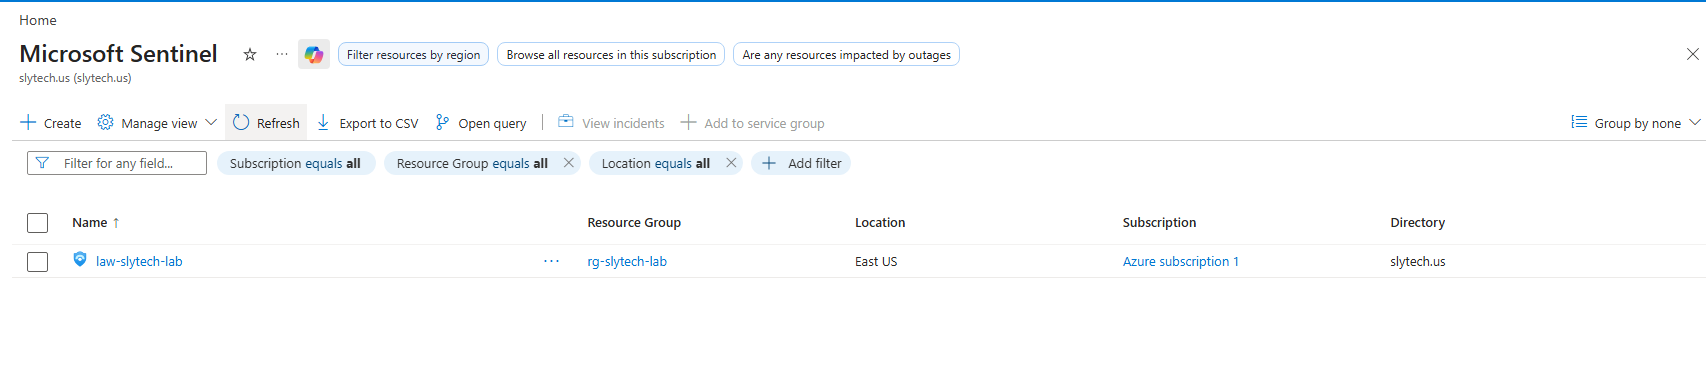
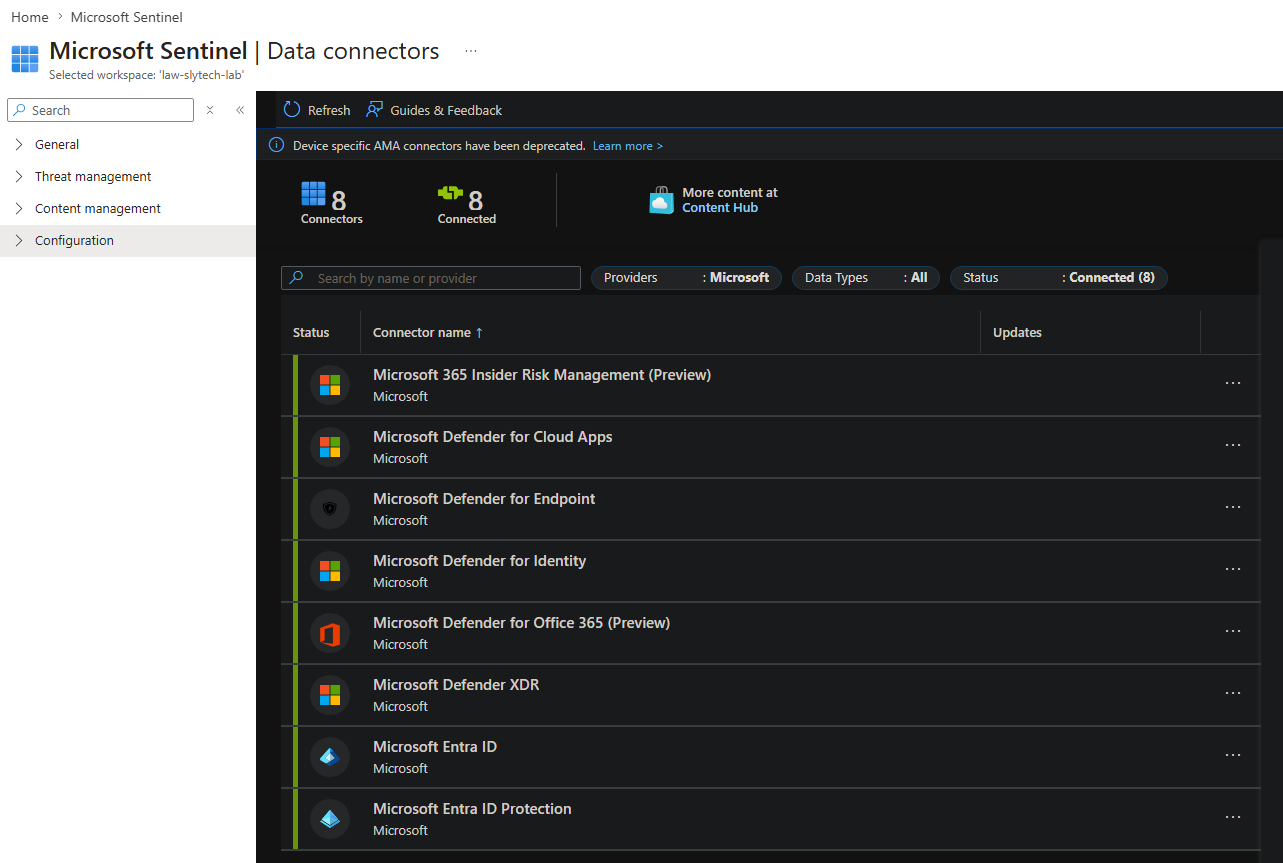
The Log Analytics workspace was already running. Sentinel connected to it directly. No new infrastructure, no separate data pipeline. Eight Microsoft data connectors auto-discovered and connected on first login.
- Microsoft Defender for Endpoint
- Microsoft Entra ID
- Microsoft Entra ID Protection
- Microsoft Defender XDR
- Microsoft Defender for Cloud Apps
- Microsoft Defender for Identity
- Microsoft Defender for Office 365
- Microsoft 365 Insider Risk Management
Everything already running in the tenant started feeding into the SIEM automatically.
The Detection Rules
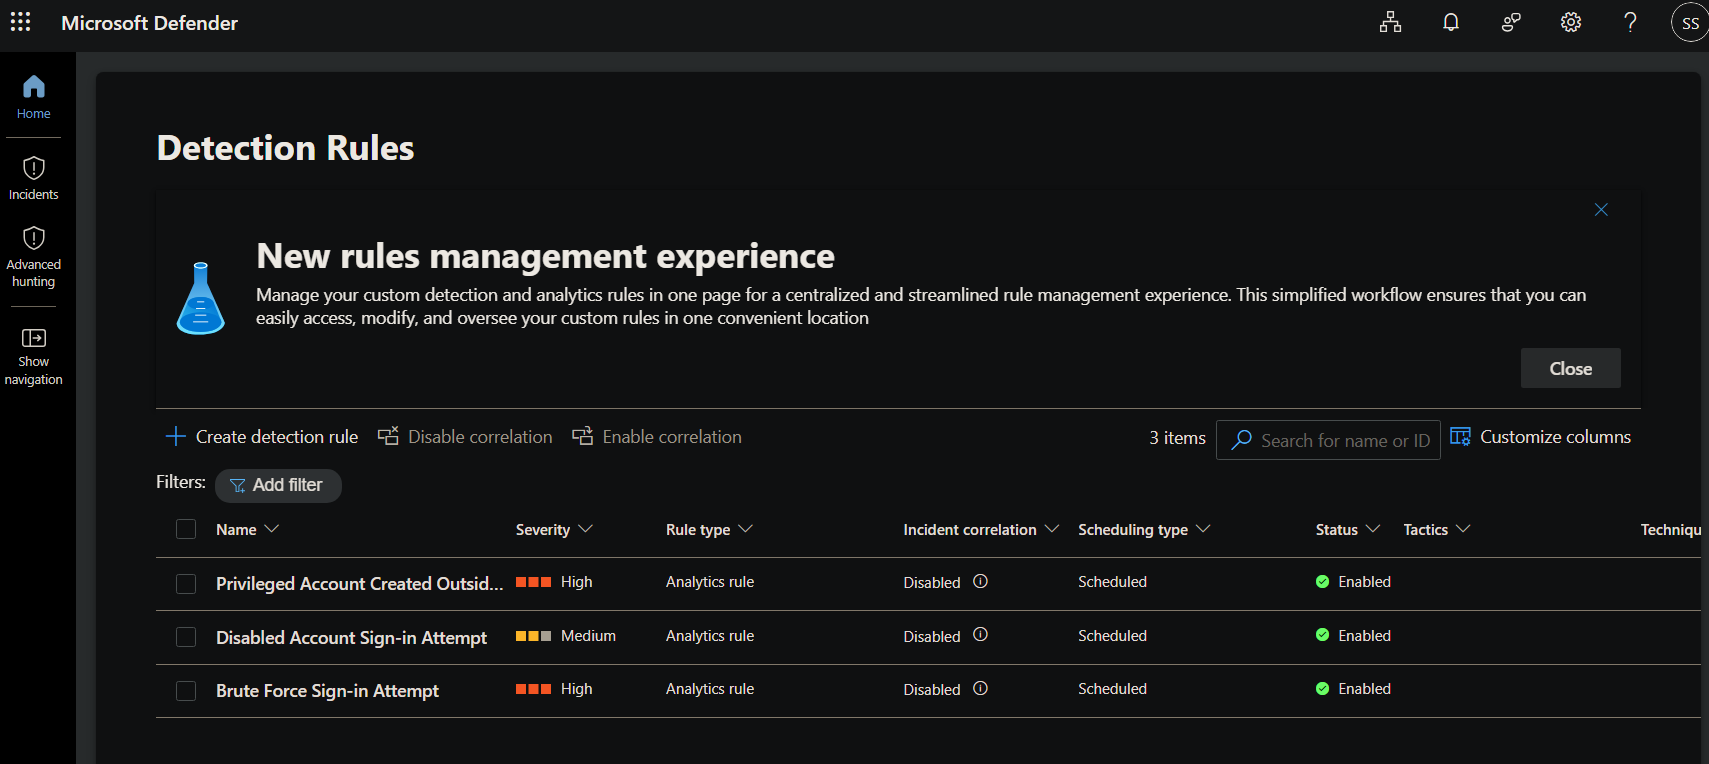
Three custom analytics rules against identity data already flowing from Entra ID.
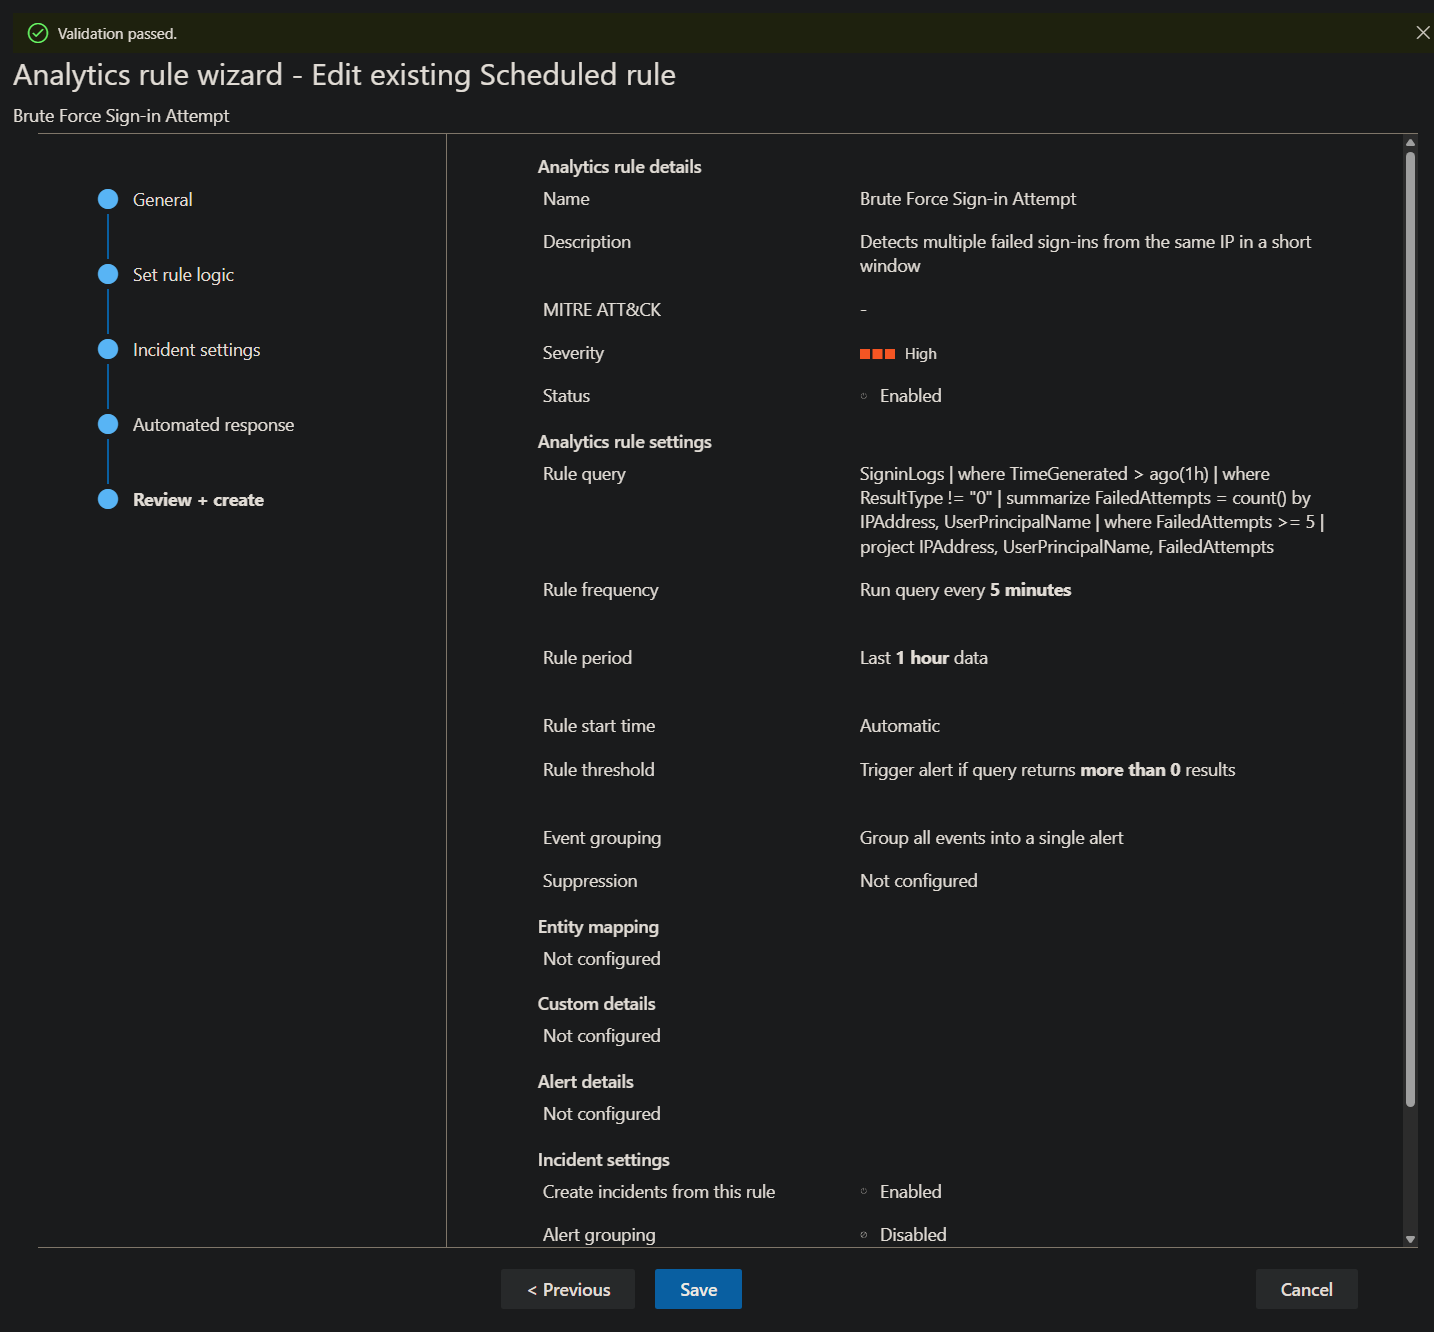
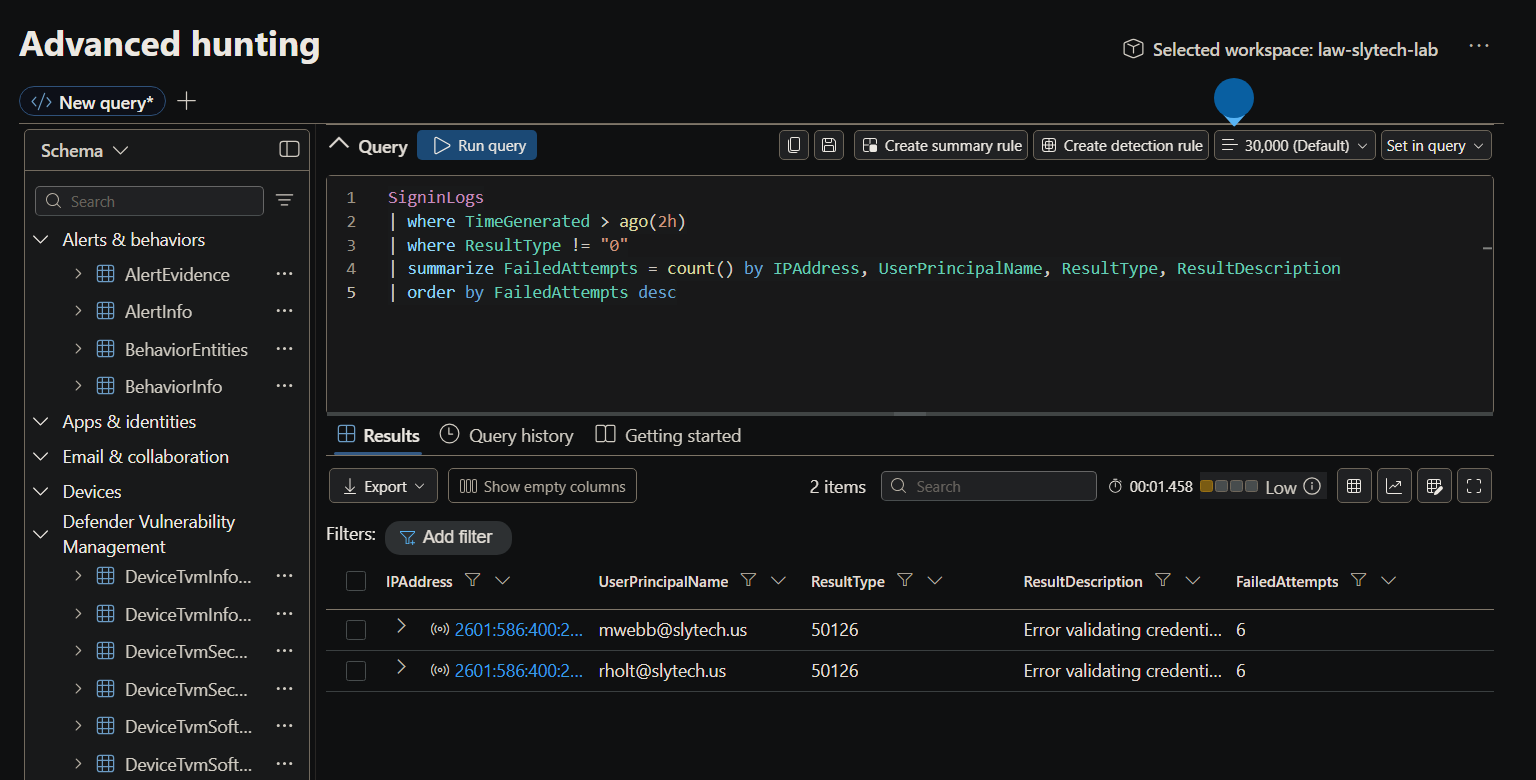
Brute Force Sign-in Attempt detects multiple failed logins from the same IP within an hour:
SigninLogs
| where TimeGenerated > ago(1h)
| where ResultType != "0"
| summarize FailedAttempts = count() by IPAddress, UserPrincipalName
| where FailedAttempts >= 5
| project IPAddress, UserPrincipalName, FailedAttempts
Disabled Account Sign-in Attempt catches authentication attempts against deprovisioned accounts. Result code 50057 is specifically “user account is disabled” in Entra ID:
SigninLogs
| where TimeGenerated > ago(1h)
| where ResultType == "50057"
| project TimeGenerated, UserPrincipalName, IPAddress, Location, ResultDescription
Privileged Account Created flags any account added to an admin or global role:
AuditLogs
| where TimeGenerated > ago(1h)
| where OperationName == "Add member to role"
| where Result == "success"
| extend TargetUser = tostring(TargetResources[0].userPrincipalName)
| extend Role = tostring(TargetResources[0].displayName)
| where Role contains "Admin" or Role contains "Global"
| project TimeGenerated, TargetUser, Role, InitiatedBy = tostring(InitiatedBy.user.userPrincipalName)
All three ran every 5 minutes, evaluated the last hour of data, and alerted on any result.
MITRE ATT&CK Mapping
| Rule | Tactic | Technique |
|---|---|---|
| Brute Force Sign-in Attempt | Credential Access | T1110 — Brute Force |
| Disabled Account Sign-in Attempt | Defense Evasion / Initial Access | T1078 — Valid Accounts |
| Privileged Account Created | Privilege Escalation | T1098 — Account Manipulation |
T1110 is what automated scanners do the moment they find an exposed service. T1078 covers what happens after an account gets compromised and then deprovisioned. T1098 is the endgame: persistence through privilege escalation.
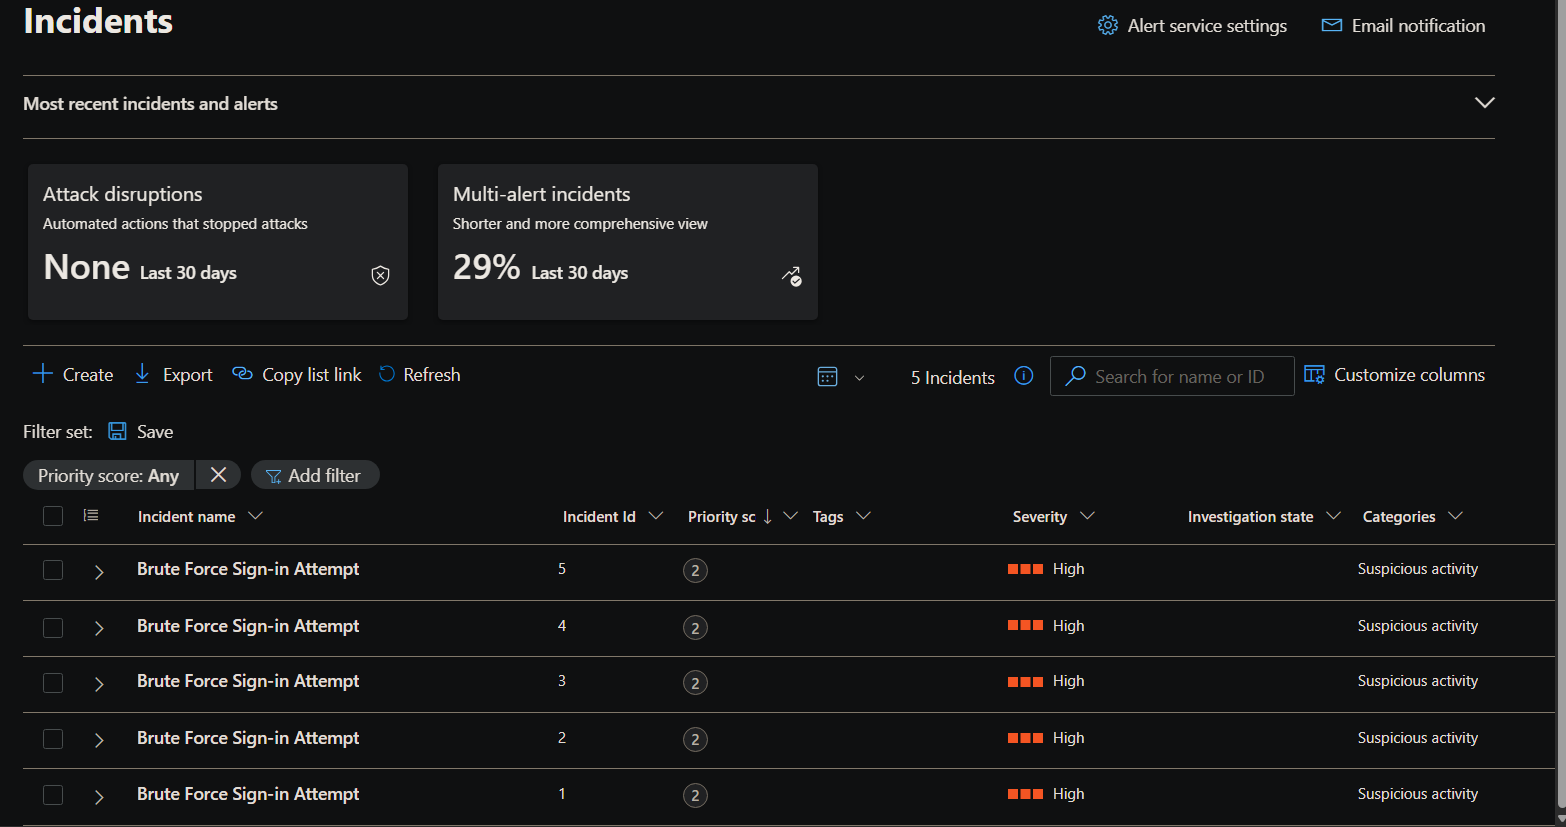
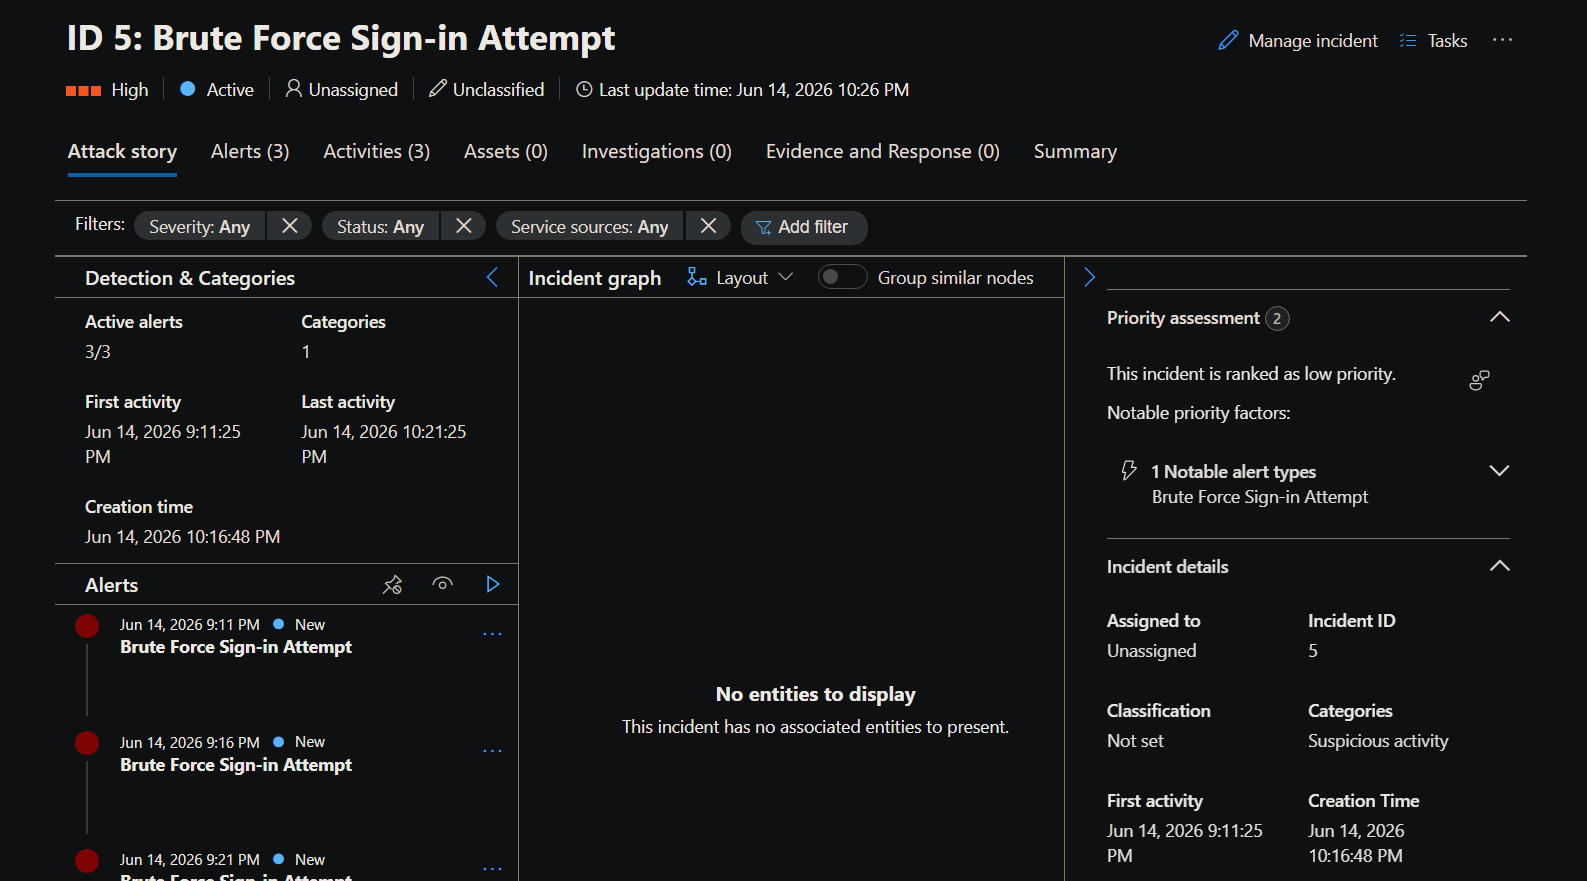
Alerts Were Firing but Incidents Weren’t
The rules were enabled, data was flowing, and the queries returned results in Advanced Hunting. Nothing appeared in the incidents queue.
Two things were working against each other. The original brute force query used bin(TimeGenerated, 5m) to group events into time buckets. Failed logins from the same IP got split across multiple bins and none crossed the threshold individually. Removing the time bin fixed it.
The second issue was incident correlation being disabled. Alerts were sitting in the SecurityAlert table without rolling up into the incidents queue. Enabling correlation and alert grouping on all three rules fixed that.
The way to check whether rules are generating alerts before blaming the rule logic:
SecurityAlert
| where TimeGenerated > ago(24h)
| project TimeGenerated, AlertName, AlertSeverity, Description
| order by TimeGenerated desc
Alerts were there. The incidents queue was the problem, not the detection.
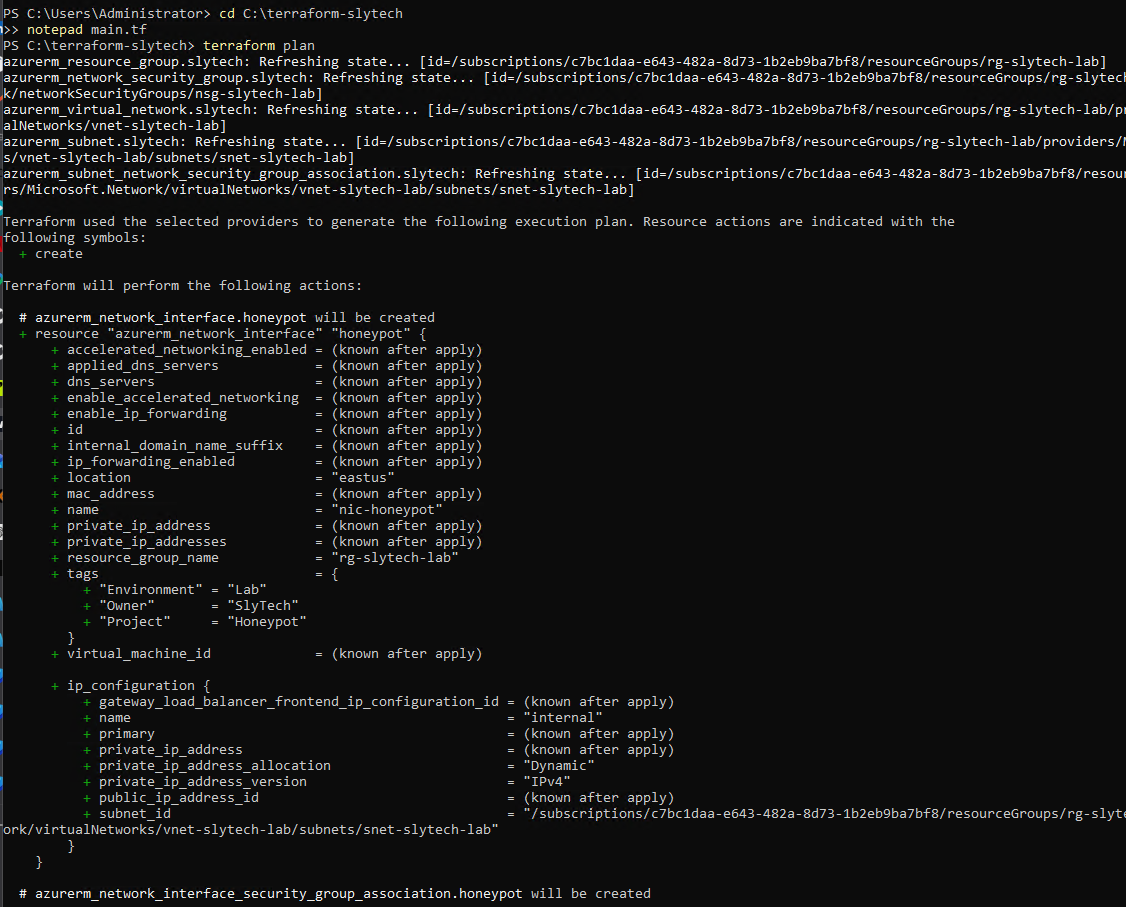
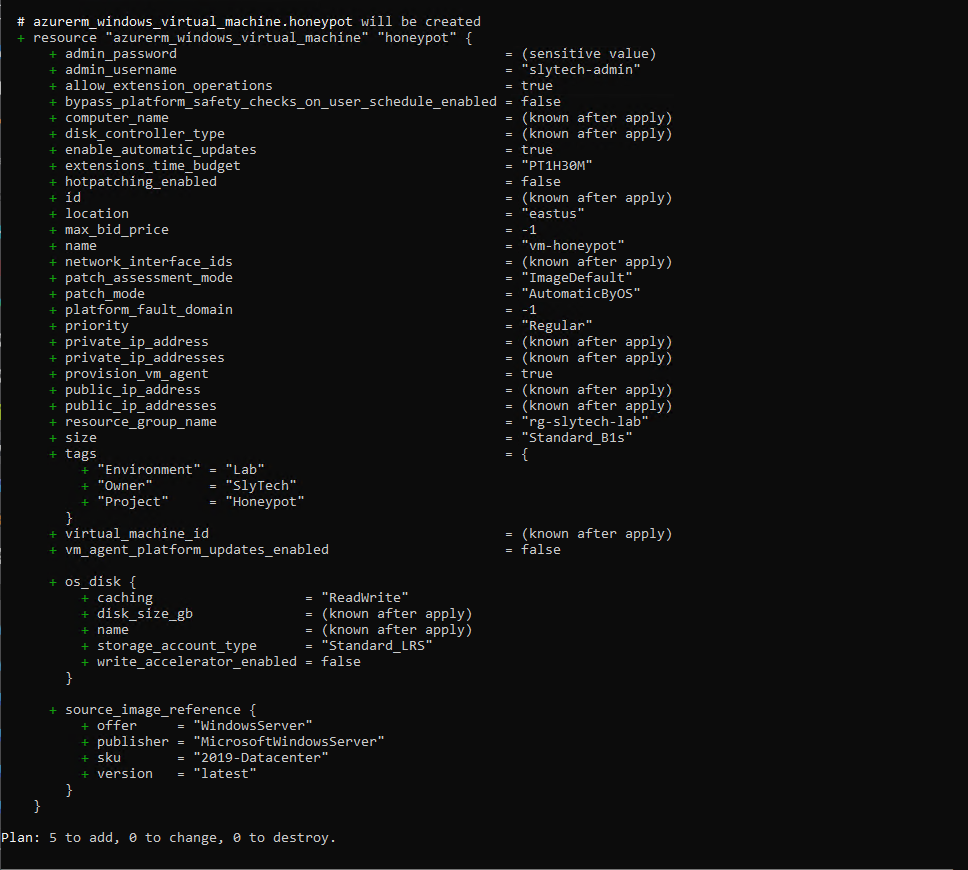
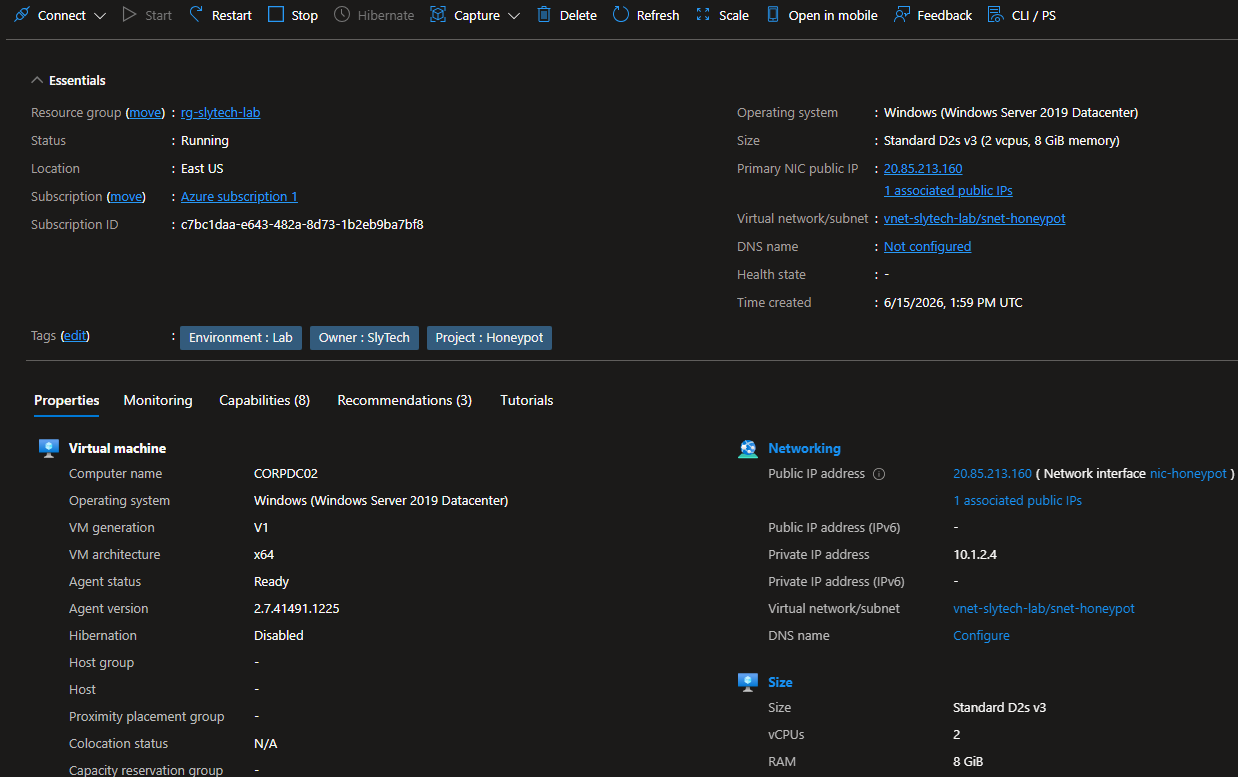
The Honeypot
A Windows Server 2019 VM provisioned via Terraform into a dedicated subnet with all inbound traffic allowed. Named CORPDC02 internally to look like a backup domain controller. Public IP exposed to the internet with RDP on port 3389 wide open.
resource "azurerm_network_security_group" "honeypot" {
  name                = "nsg-honeypot"
  location            = azurerm_resource_group.slytech.location
  resource_group_name = azurerm_resource_group.slytech.name
  security_rule {
    name                       = "allow-all-inbound"
    priority                   = 100
    direction                  = "Inbound"
    access                     = "Allow"
    protocol                   = "*"
    source_port_range          = "*"
    destination_port_range     = "*"
    source_address_prefix      = "*"
    destination_address_prefix = "*"
  }
}
The VM went on its own subnet because the main lab subnet NSG has RDP deny rules. Traffic hits the subnet NSG before the NIC-level NSG, so the honeypot’s allow-all rule was getting overridden. A dedicated subnet with no restrictive rules fixed it.
Getting logs from the honeypot into Sentinel required switching from the deprecated MMA agent to the Azure Monitor Agent and creating a Data Collection Rule targeting Security Events. The AMA agent also needed a managed identity assigned to the VM before it would connect.
az vm identity assign -g rg-slytech-lab -n vm-honeypot
az vm extension set `
    --resource-group rg-slytech-lab `
    --vm-name vm-honeypot `
    --name AzureMonitorWindowsAgent `
    --publisher Microsoft.Azure.Monitor `
    --version 1.22 `
    --enable-auto-upgrade true
The First Few Hours
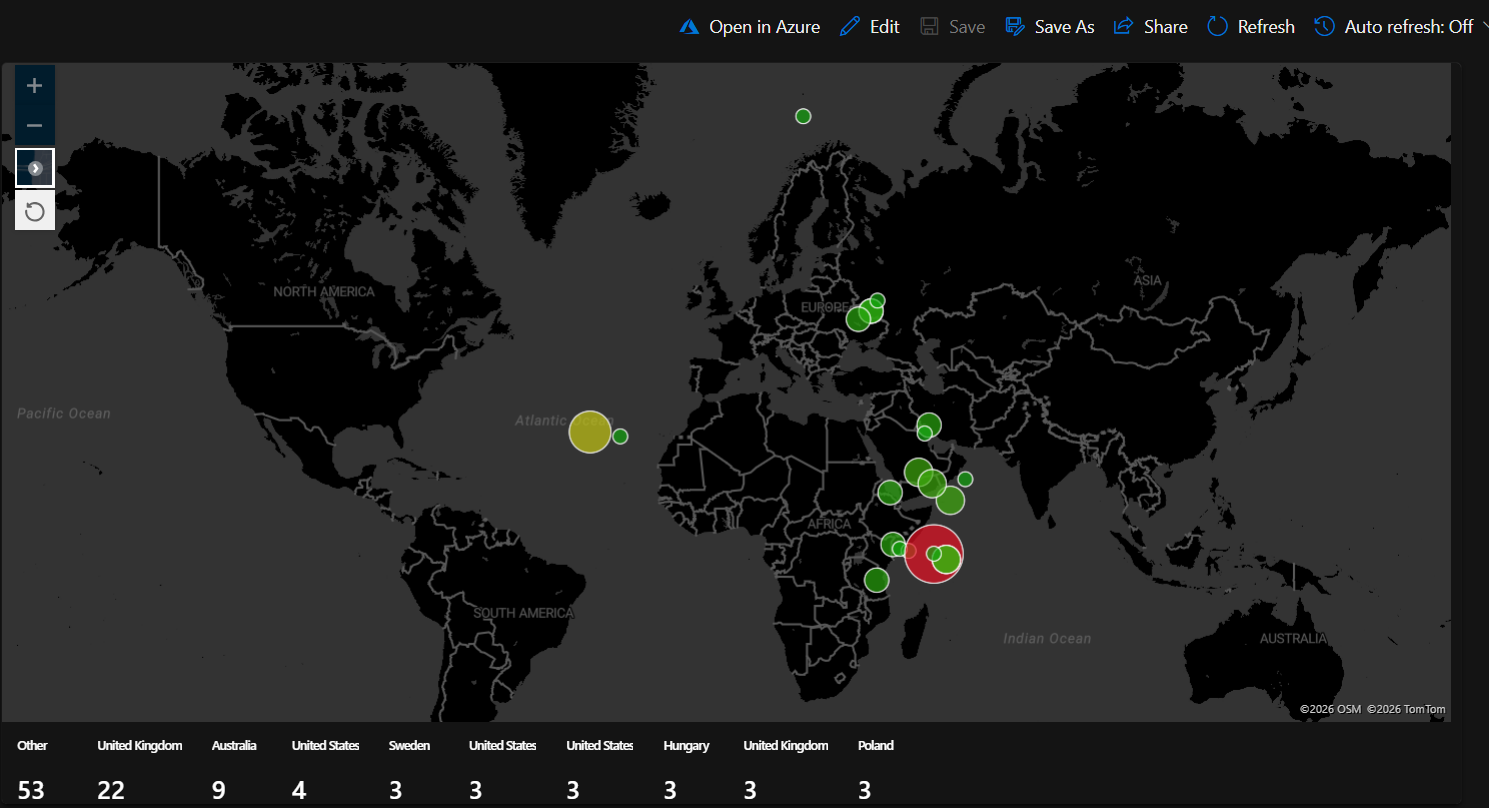
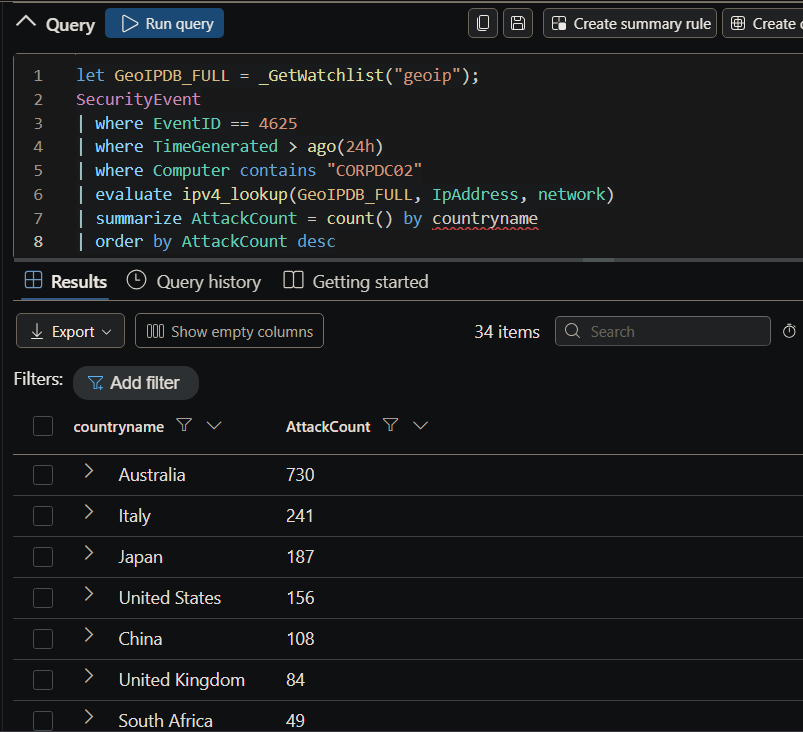
Within the first few hours of the VM being live, 53 attacks were already visible on the map. The geographic enrichment query joins attack IPs against a 54,000-record GeoIP watchlist imported into Sentinel:
let GeoIPDB_FULL = _GetWatchlist("geoip");
SecurityEvent
| where EventID == 4625
| where TimeGenerated > ago(24h)
| where Computer contains "CORPDC02"
| evaluate ipv4_lookup(GeoIPDB_FULL, IpAddress, network)
| summarize AttackCount = count() by IpAddress, cityname, countryname, latitude, longitude
| where AttackCount > 0 and isnotempty(latitude) and isnotempty(longitude)
The automated tools hitting the machine cycled through the same username list: Admin, Administrator, user, corpdc02, Windows, Accounting, test. They didn’t know what was on the machine. Every RDP-exposed IP on the internet gets the same treatment.
One thing worth noting on the map setup: the Defender portal workbook editor wouldn’t accept latitude/longitude column mappings through its UI. Opening the same workbook in the Azure portal editor, configuring the map settings there, and the changes synced back to the Defender portal.
Overnight
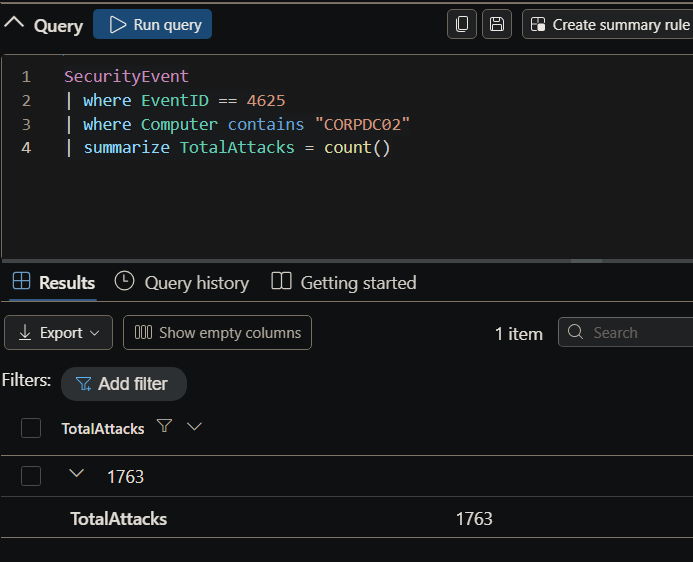
Left the honeypot running overnight. The numbers tell the rest of the story.
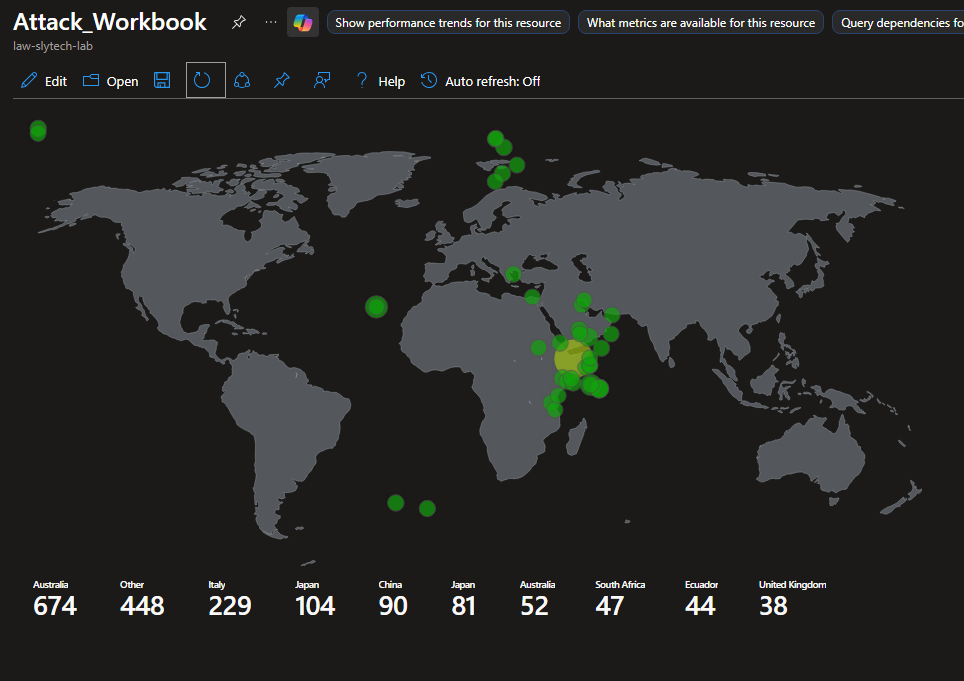
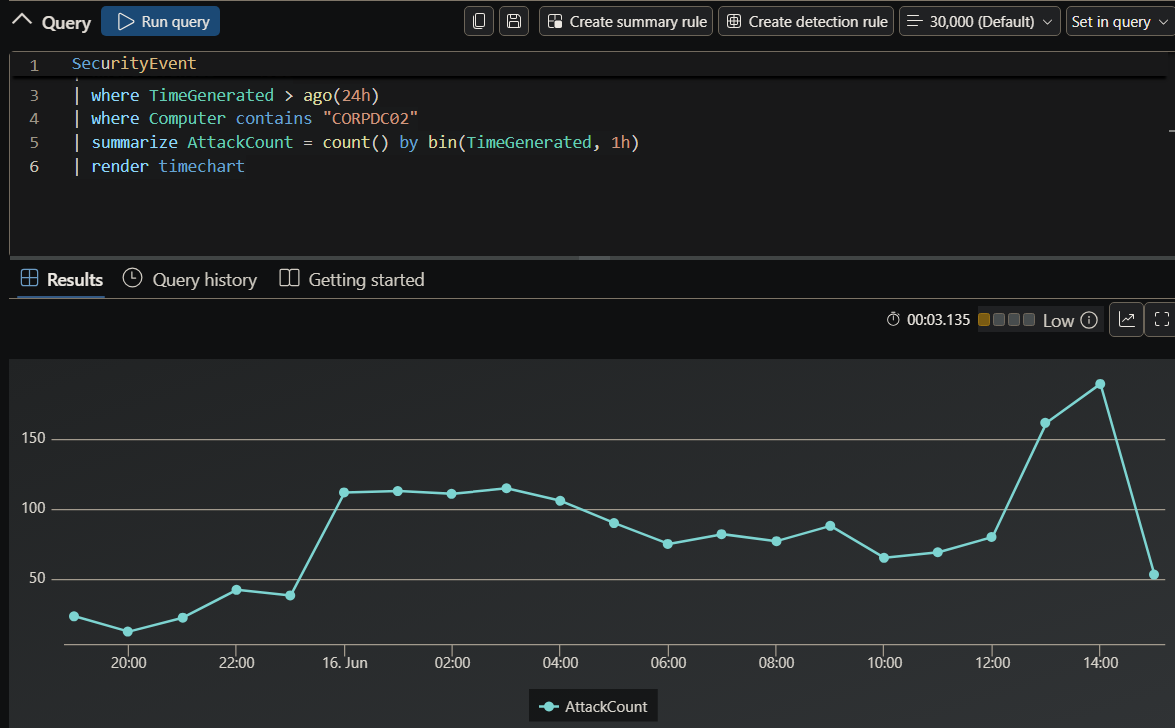
In just under 24 hours, the honeypot logged 1,763 failed login attempts from 34 countries. No vulnerability exploited, no phishing link clicked. Just an exposed port and a recognizable machine name.
Lessons Learned
Building detections in a lab against manufactured data is useful. Watching attack traffic roll in from 34 different countries against a machine that was live for less than 24 hours is different. The rule firing, the incident appearing, the source IPs mapping to a world map, that is when the detection pipeline stops being abstract.
The honeypot data also confirmed something worth reinforcing in any environment: Administrator, admin, user, and the machine’s own hostname are the first usernames every automated scanner tries. If any of those exist as active accounts in a real environment, they are getting hit constantly. Rename them, disable them, or put them behind MFA at minimum. The logs make this impossible to ignore when you are watching it happen in real time.