Building a Splunk SIEM Lab on Proxmox, Part 3: MITRE ATT&CK Mapping and Building a Complete SOC Workflow
Part 1 and Part 2 got data flowing and detections running. By the end of Part 2 I had a brute force alert firing every 5 minutes and a dashboard showing failed logon activity across the lab. But running detections and having a SOC workflow are two different things. Part 3 closes the loop.
This is the part where the lab starts looking less like a project and more like something a real detection engineer would build.
Installing Splunk Security Essentials
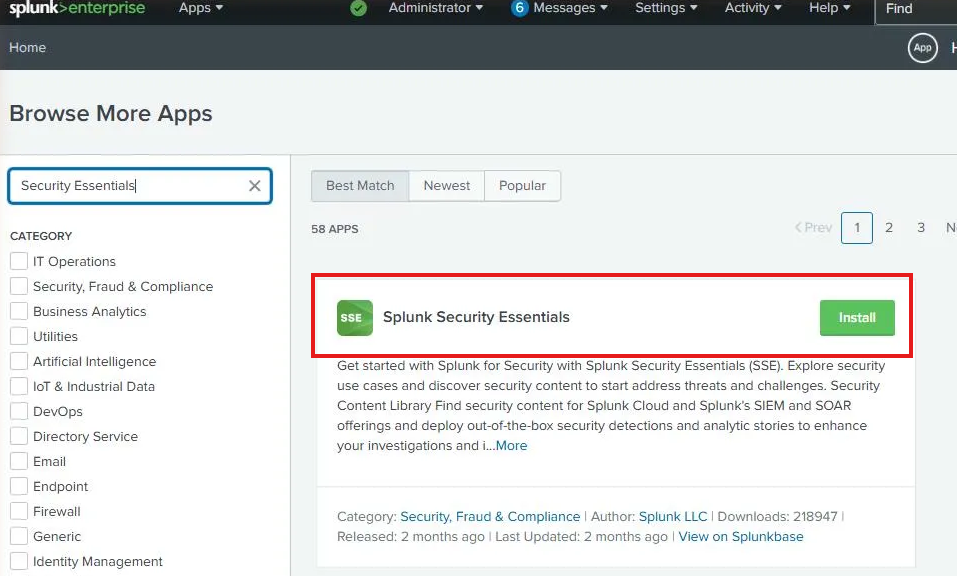
Splunk Security Essentials (SSE) is a free app from Splunk that maps your detections to the MITRE ATT&CK framework, provides pre-built detection content, and shows you coverage gaps across your environment. It installs directly from Splunkbase inside Splunk.
Go to Apps → Browse More Apps, search for “Splunk Security Essentials” and hit Install.
The install went smoothly but the app wouldn’t load properly after. Every dashboard panel threw a JavaScript error. This is a known issue and I want to document the fix because it’ll waste your afternoon if you hit it and don’t know where to look.
The KV Store Problem Nobody Mentions
The JavaScript errors weren’t a browser issue. They were a symptom of the KV Store being in a failed state. SSE relies heavily on Splunk’s KV Store (which runs on MongoDB internally) for its bookmark data, app config, and content library. If KV Store is down, SSE’s dashboards fail to load.
Checking the status confirmed it:
sudo /opt/splunk/bin/splunk show kvstore-status --run-as-root
The output showed status: failed. The logs told the real story:
mongod exited abnormally (exit code 4, status: PID killed by signal 4: Illegal instruction)
Signal 4 is SIGILL, an illegal instruction. MongoDB 6.x, which ships with Splunk 10.x, requires AVX CPU instructions. My Splunk VM was running with the default QEMU CPU type which doesn’t expose AVX to the guest.
One command from the Citadel Proxmox shell fixed it:
qm stop 300
qm set 300 --cpu host
qm start 300
Passing --cpu host exposes the physical CPU’s full instruction set to the VM, including AVX. After the restart, MongoDB started cleanly and KV Store came up. SSE loaded without errors.
This is a detail that trips up anyone running Splunk 10.x on Proxmox with default CPU settings. The error message points you toward MongoDB logs that are empty, which makes the root cause hard to find without knowing what to look for.
Mapping to MITRE ATT&CK
With SSE working, the first thing I wanted to do was find the detection content that matched what we built in Part 2. Searching for T1110 in the Security Content library returned seven detections in the Brute Force category.
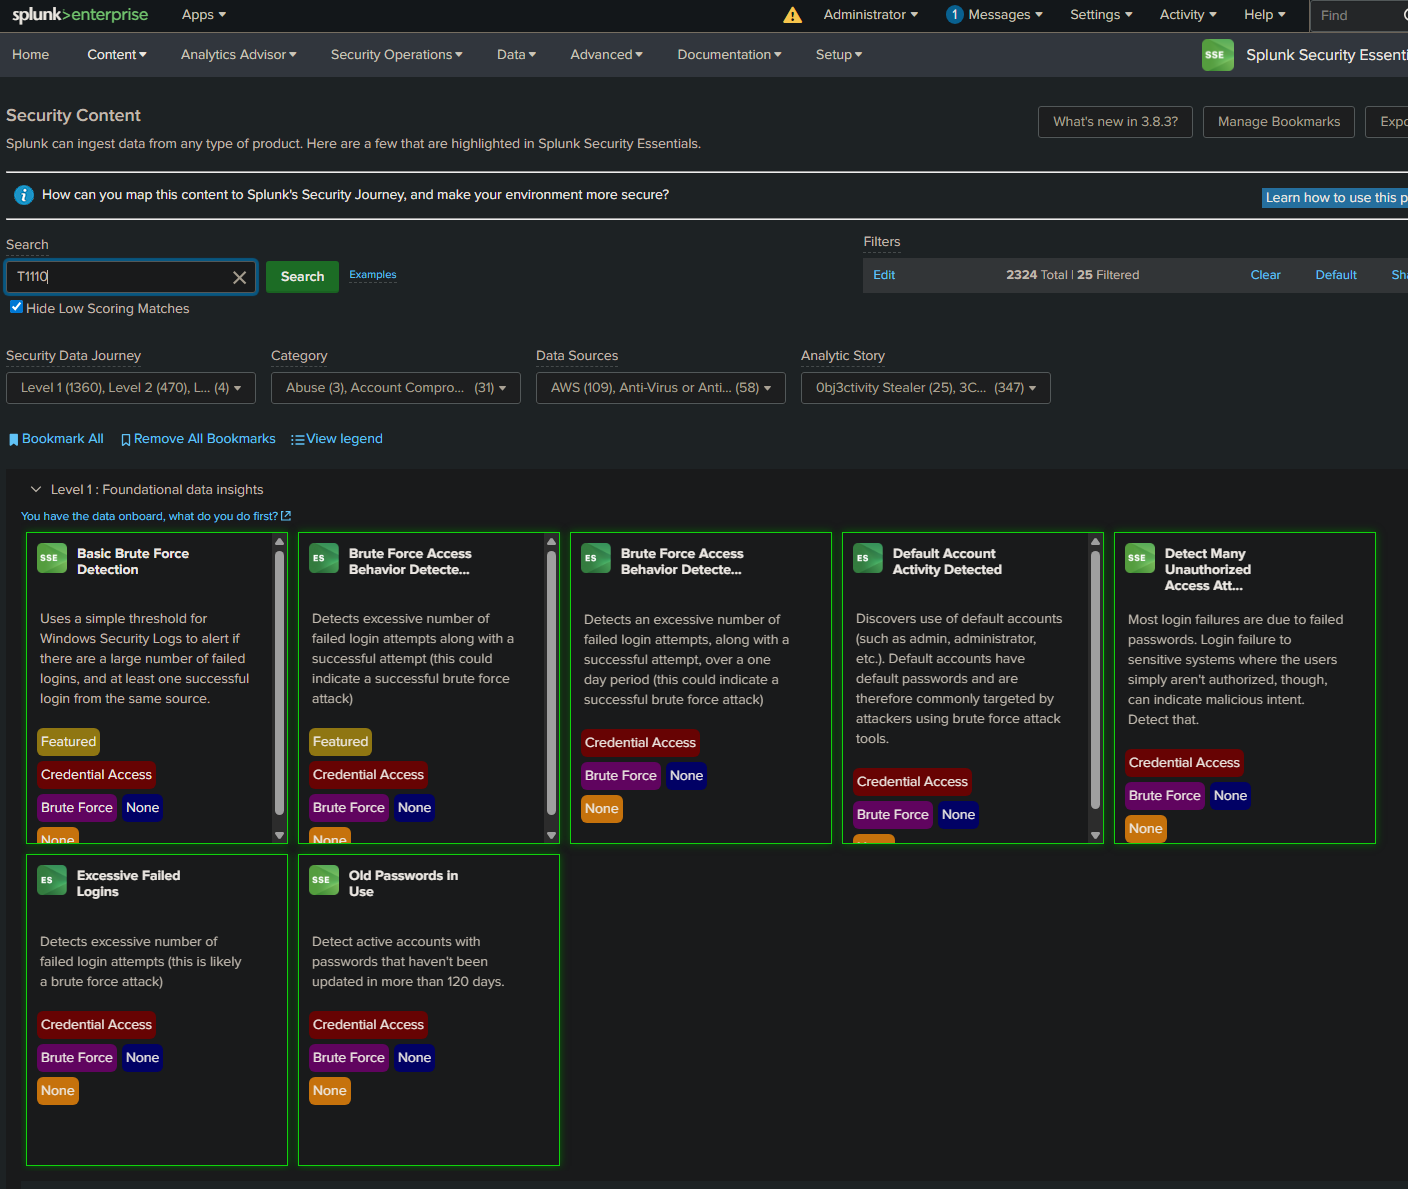
The Basic Brute Force Detection is the closest match to the SPL we wrote in Part 2. Opening it shows the full ATT&CK context that makes this more than just a Splunk search.
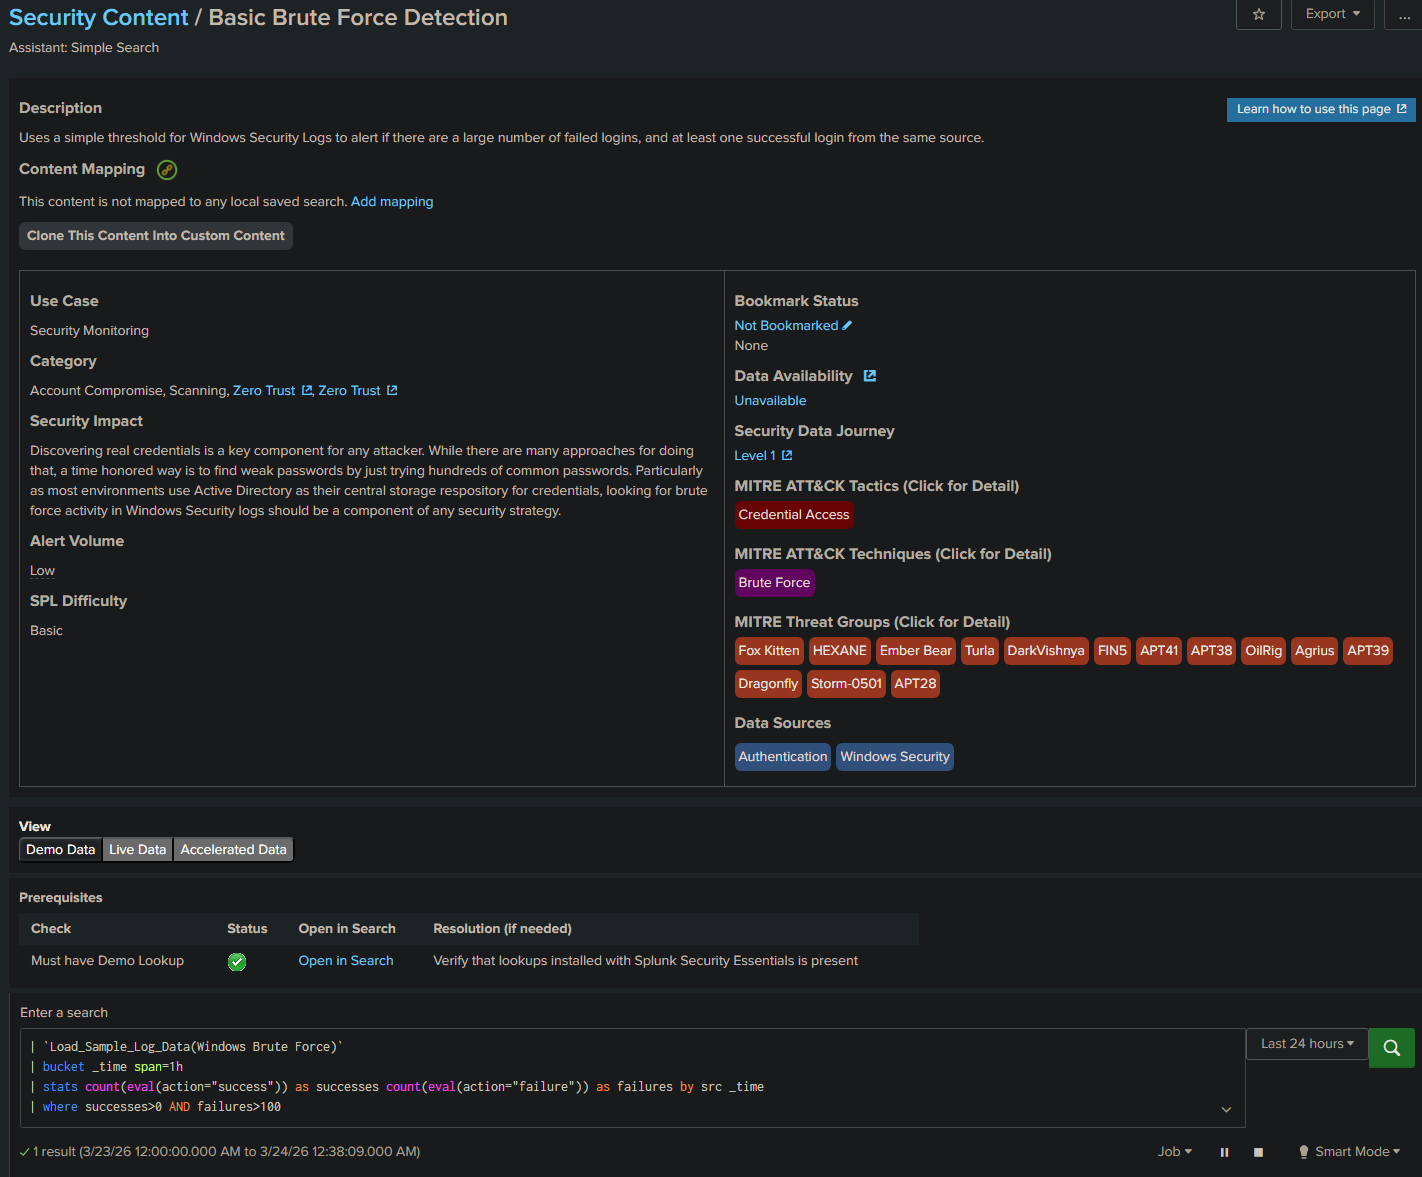
The right panel maps the detection to:
- Tactic: Credential Access
- Technique: Brute Force
- Threat Groups: Fox Kitten, HEXANE, Ember Bear, Turla, DarkVishnya, FIN5, APT41, APT38, OilRig, Agrius, APT39, Dragonfly, Storm-0501, APT28
The same technique we detected with EventCode 4625 is used by APT38, APT41, and over a dozen other known threat actor groups. That context is what turns a Splunk search into a detection engineering artifact.
The CIM Gap and How to Fix It
Clicking Live Data on the Basic Brute Force Detection showed something interesting.
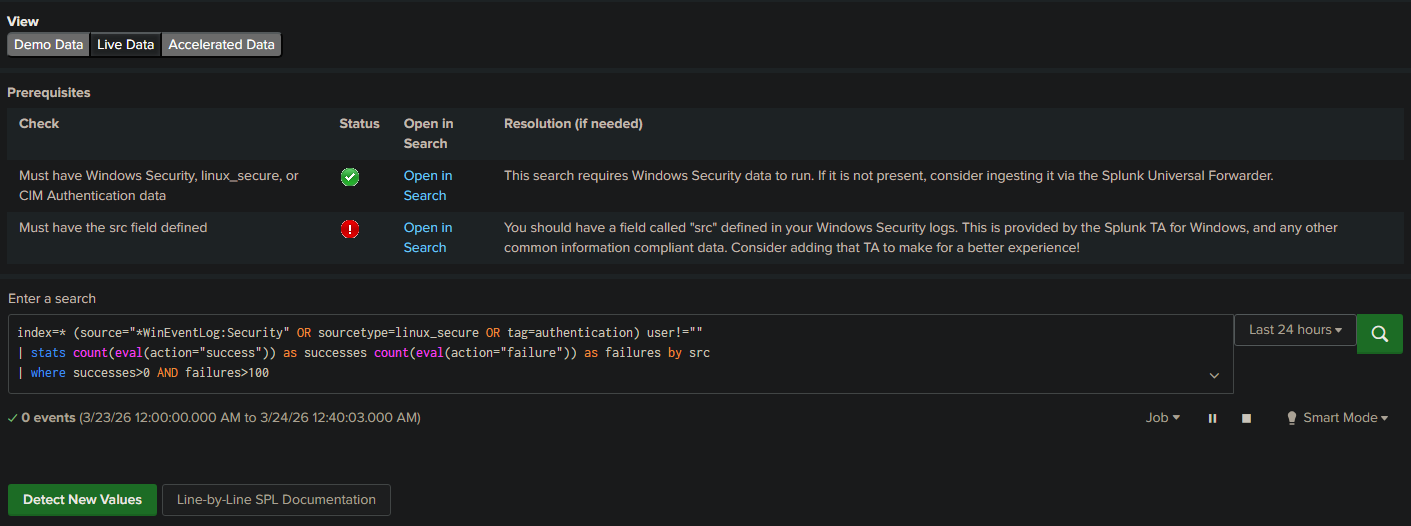
Zero events, and a red warning: “Must have the src field defined.” SSE uses Splunk’s Common Information Model (CIM) which normalizes field names across data sources. The CIM Authentication data model uses src as the source IP field. Our raw Windows Event Logs use Source_Network_Address instead.
The fix is installing the Splunk Add-on for Microsoft Windows (the Windows TA). It maps Windows Security event fields to CIM standards automatically, including adding the src field that SSE expects.
After installing the TA from Splunkbase and restarting Splunk:
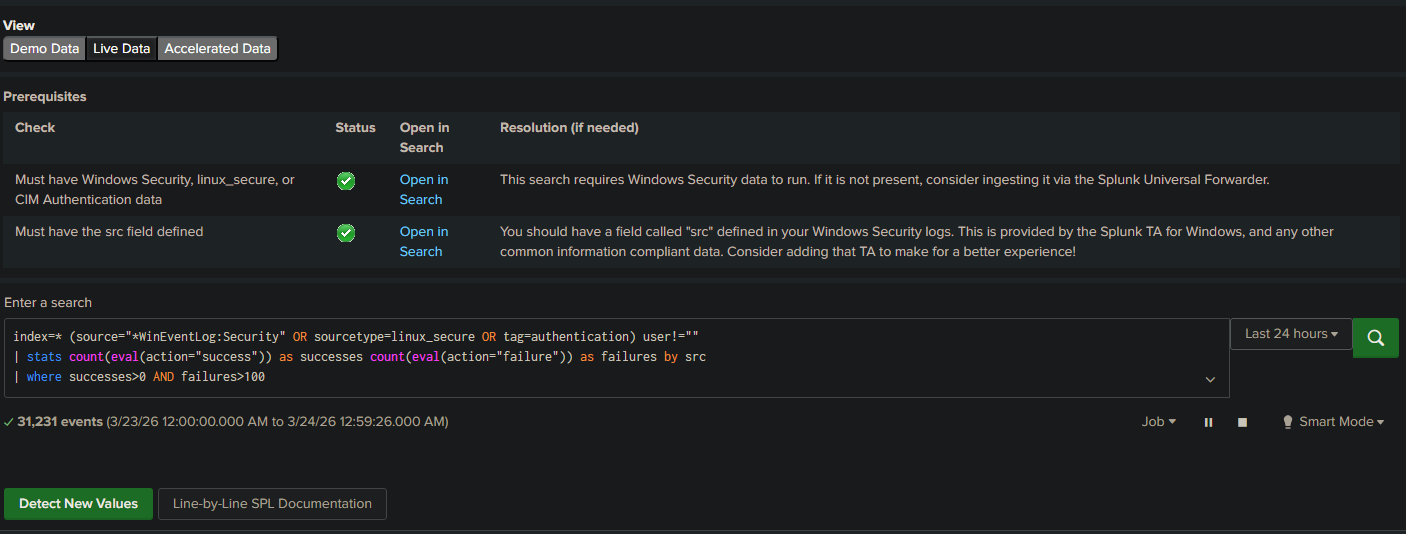
Both checkmarks green. 31,231 events now being analyzed by the SSE detection. The before and after here is the point: raw Windows logs work for custom SPL searches, but if you want to use SSE or any CIM-based detection content, the TA is not optional. Install it from the start.
Simulating the Attack
With the detection pipeline working, I wanted real attack data to validate it. I used Hydra from the Kali VM on Citadel to run a credential attack against the Splunk server over SSH.
hydra -l slytech -P /tmp/passwords.txt -t 4 -V -I ssh://10.0.0.228
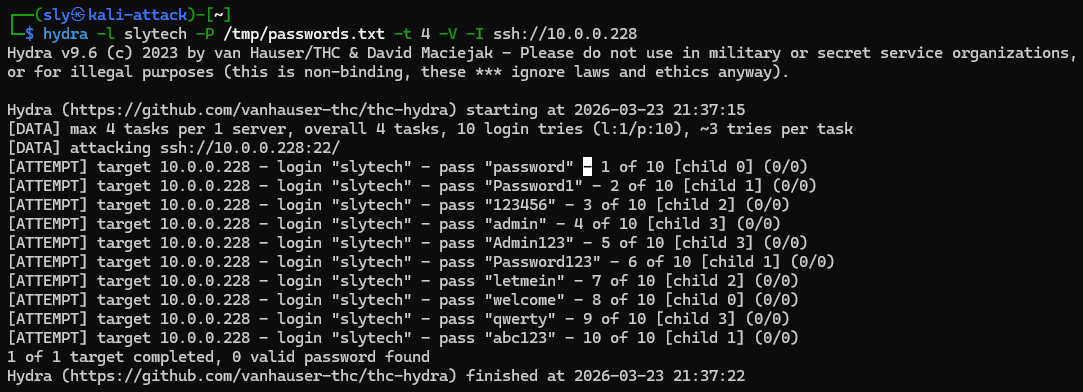
Ten attempts, ten failures. The attack completed in under 10 seconds. On the Windows side I also ran manual failed logon attempts against win11-002 to generate 4625 events for the Windows detection.
Checking Splunk confirmed the events landed:
index=main host=win11-002 EventCode=4625 earliest=-1h
| stats count by Account_Name Source_Network_Address
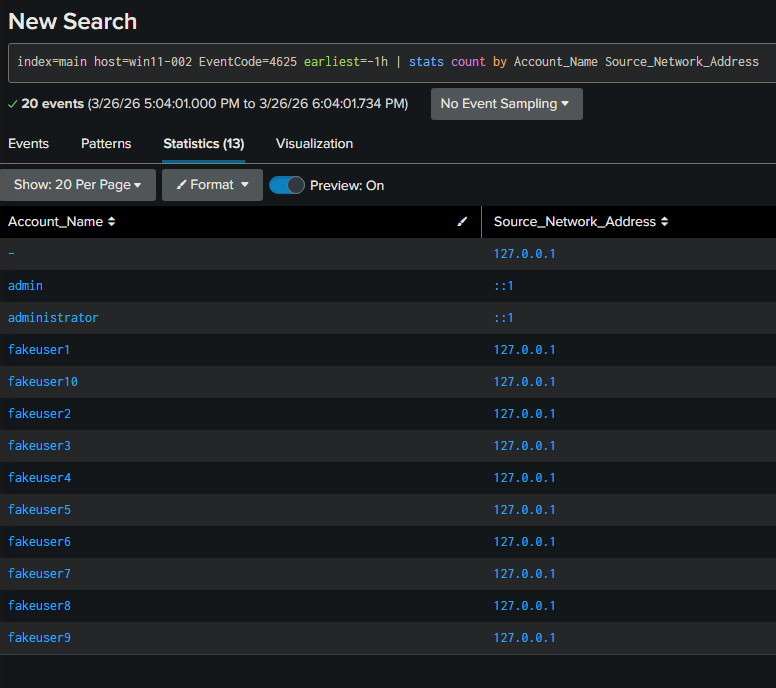
20 events. The fakeuser1 through fakeuser10 accounts from the loopback test, plus admin and administrator attempts from the network. Source addresses, account names, and counts all parsed automatically by the Windows TA.
Cloning and Customizing the Detection
SSE content is read-only but you can clone any detection into Custom Content and modify it for your environment. This is the detection engineering workflow in practice.
Clicking Clone This Content Into Custom Content opens a form where you define the detection’s metadata and map it to your local saved search.
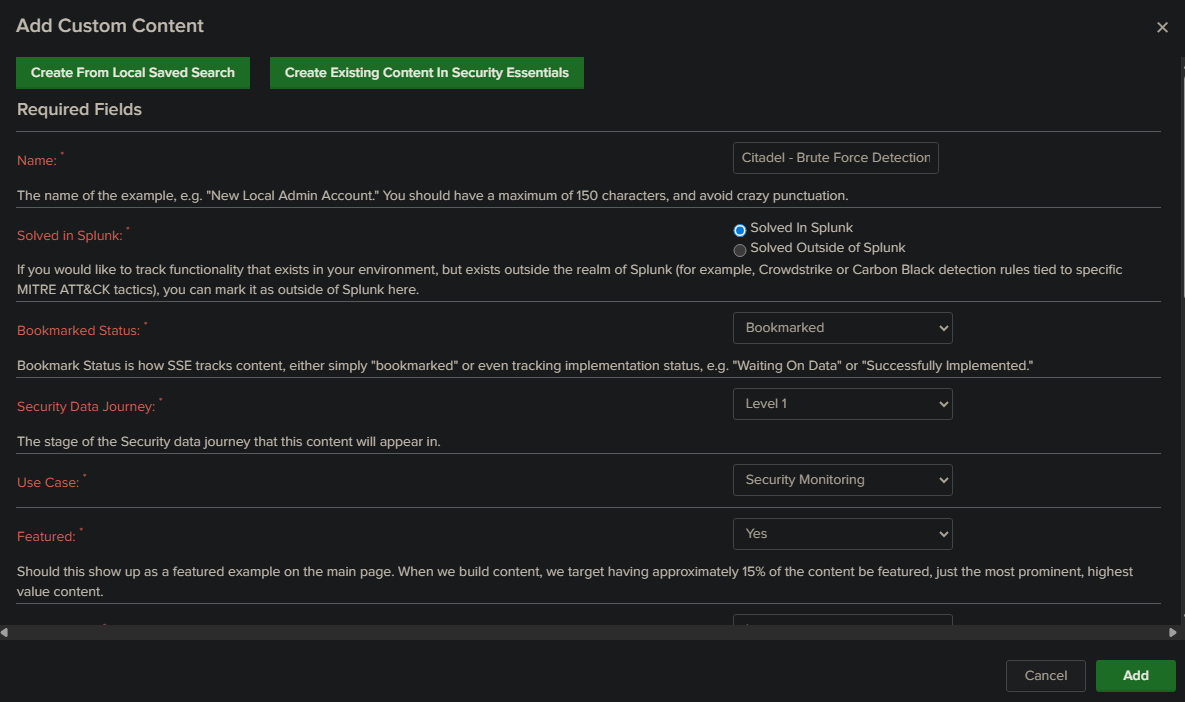
I named it Citadel - Brute Force Detection, set it to Solved In Splunk, and bookmarked it. This creates a custom detection entry in SSE that tracks implementation status and maps back to the ATT&CK technique. Every environment should have a detection registry like this, even in a homelab.
The Bigger Picture
At the end of three parts, here is what the Citadel lab has:
A Splunk instance ingesting Windows Security, System, and Application logs from a domain controller and a standalone workstation. A brute force detection alert running on a 5-minute cron schedule. A SOC dashboard with four panels covering failed logons, timeline, top targeted accounts, and active brute force windows. A detection formally mapped to MITRE ATT&CK T1110 and tracked in the SSE custom content registry.
That is a functional detection engineering pipeline built on commodity homelab hardware.
What I built on top of this is documented in a separate post: an AI-assisted triage layer that pulls events from Splunk, sends them to the Anthropic API, and returns a structured SOC report with ATT&CK mapping and triage priorities. The AI layer flagged the Hydra attack as CRITICAL, identified the sequential fakeuser accounts as T1087.001 enumeration, and correctly called my own DarkShell failed logins as HIGH severity sustained credential testing. It was right to flag all of them. Whether a source is trusted is context the tool doesn’t have without you giving it that context first.
That is the real lesson from this whole series. Tools detect patterns. Analysts provide context. The goal of building this lab was to understand where one ends and the other begins.
What’s Next
The detection layer is solid. The next step is automating the response side: scheduled Splunk queries, Telegram alerts when the brute force detection fires, and an asset context file that tells the AI triage layer which sources are trusted before it starts flagging my own VMs as attacker infrastructure.