AI-Assisted SOC Triage on Top of Splunk Using the Anthropic API
I finished Part 3 of my Splunk lab series and immediately had the same thought I always have after a big lab build: okay, data is flowing, detections are running, but I’m still the one manually reading through events. That’s the gap I wanted to close.
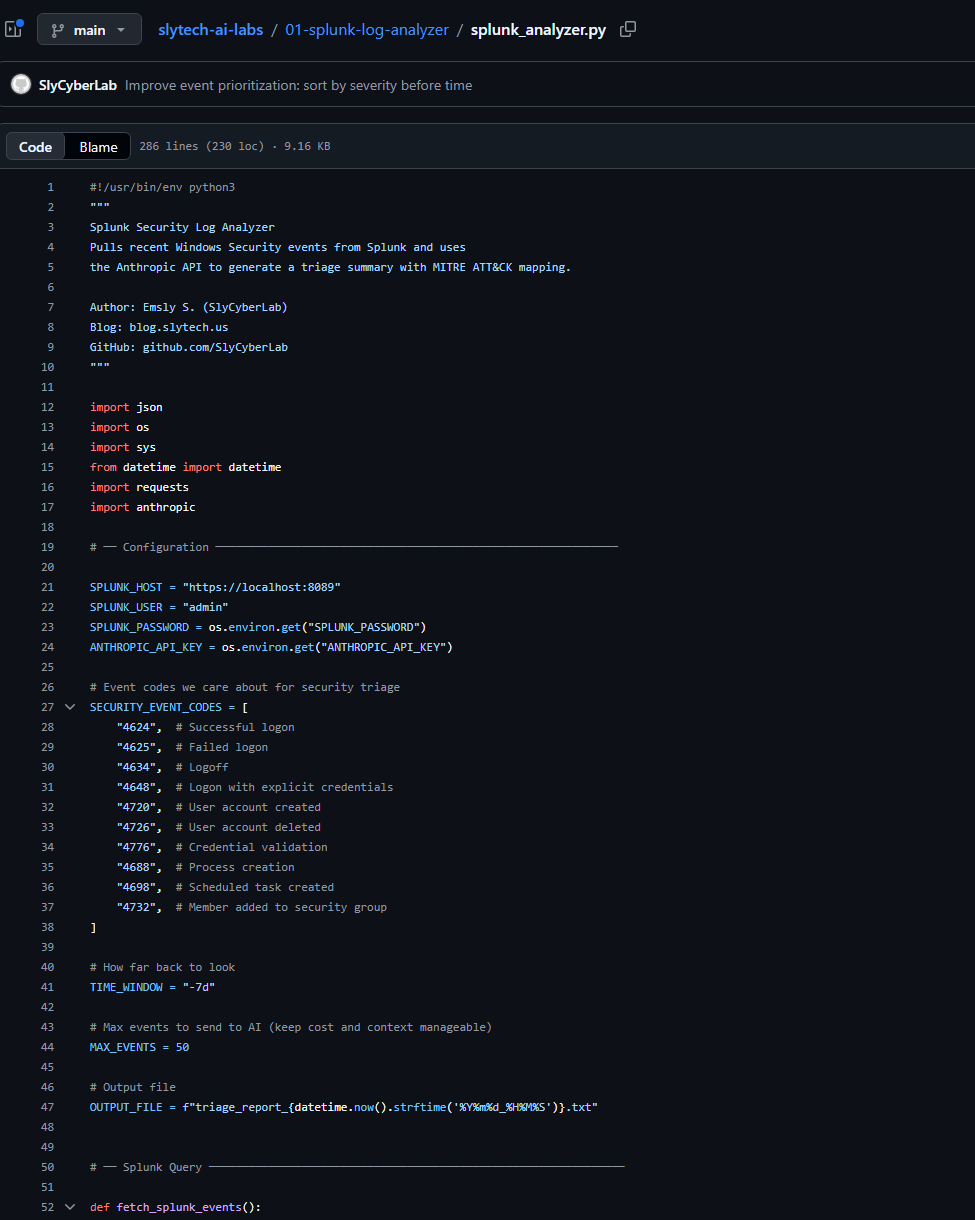
So I built a Python tool that pulls Windows Security events from Splunk, sends them to the Anthropic API, and gets back a structured SOC triage report with MITRE ATT&CK mapping. The whole thing runs in one command. The output that came back on the first real run flagged four attack patterns in my lab, including my own failed logins from a trusted VM listed as a HIGH severity brute force. That part I’ll come back to.
Why AI on Top of Splunk
Splunk already does correlation searches. I use them. But there’s a gap between a fired alert and understanding what it actually means. A real analyst doesn’t look at one event. They look at the pattern, the timing, the source IP, the sub-status codes, and they connect it to known attacker behavior.
That contextual reasoning is where large language models are genuinely useful. Not replacing the analyst. Doing the first-pass work so the analyst spends time on what matters instead of reading through 200 lines of DC01 machine account noise.
The goal was simple: pull events from Splunk, pass them to an AI with a well-structured prompt, get back a triage report I’d actually find useful. No frontend, no database, no over-engineering.
The Stack
- Splunk Enterprise on a dedicated Ubuntu VM in Citadel, my security-focused Proxmox cluster
- Universal Forwarders on
dc01.slytech.usand a Linux endpoint - Python 3.10 running directly on the Splunk VM
- Anthropic API for the AI triage layer
- Splunk REST API on port 8089 for programmatic event retrieval
Everything runs on the same VM. One command, one output.
The Thing That Bit Me First
The Splunk REST API returns results as one JSON object per line, not a single JSON array. If you try to parse the full response at once it fails immediately with no useful error message. You have to split by newline and parse each line individually.
for line in response.text.strip().split("\n"):
    if not line:
        continue
    try:
        obj = json.loads(line)
        result = obj.get("result", {})
    except json.JSONDecodeError:
        continue
The other thing nobody mentions: Windows Security event messages are full of \r\n and \t characters. Sending that raw to an AI produces messy output that wastes tokens and degrades the analysis quality. Clean it before you send it.
message = message.replace("\r\n", " ").replace("\t", " ")
while "  " in message:
    message = message.replace("  ", " ")
Two lines. Took me longer than I want to admit to figure out why the first few outputs looked garbled.
Getting the Right Events to Surface
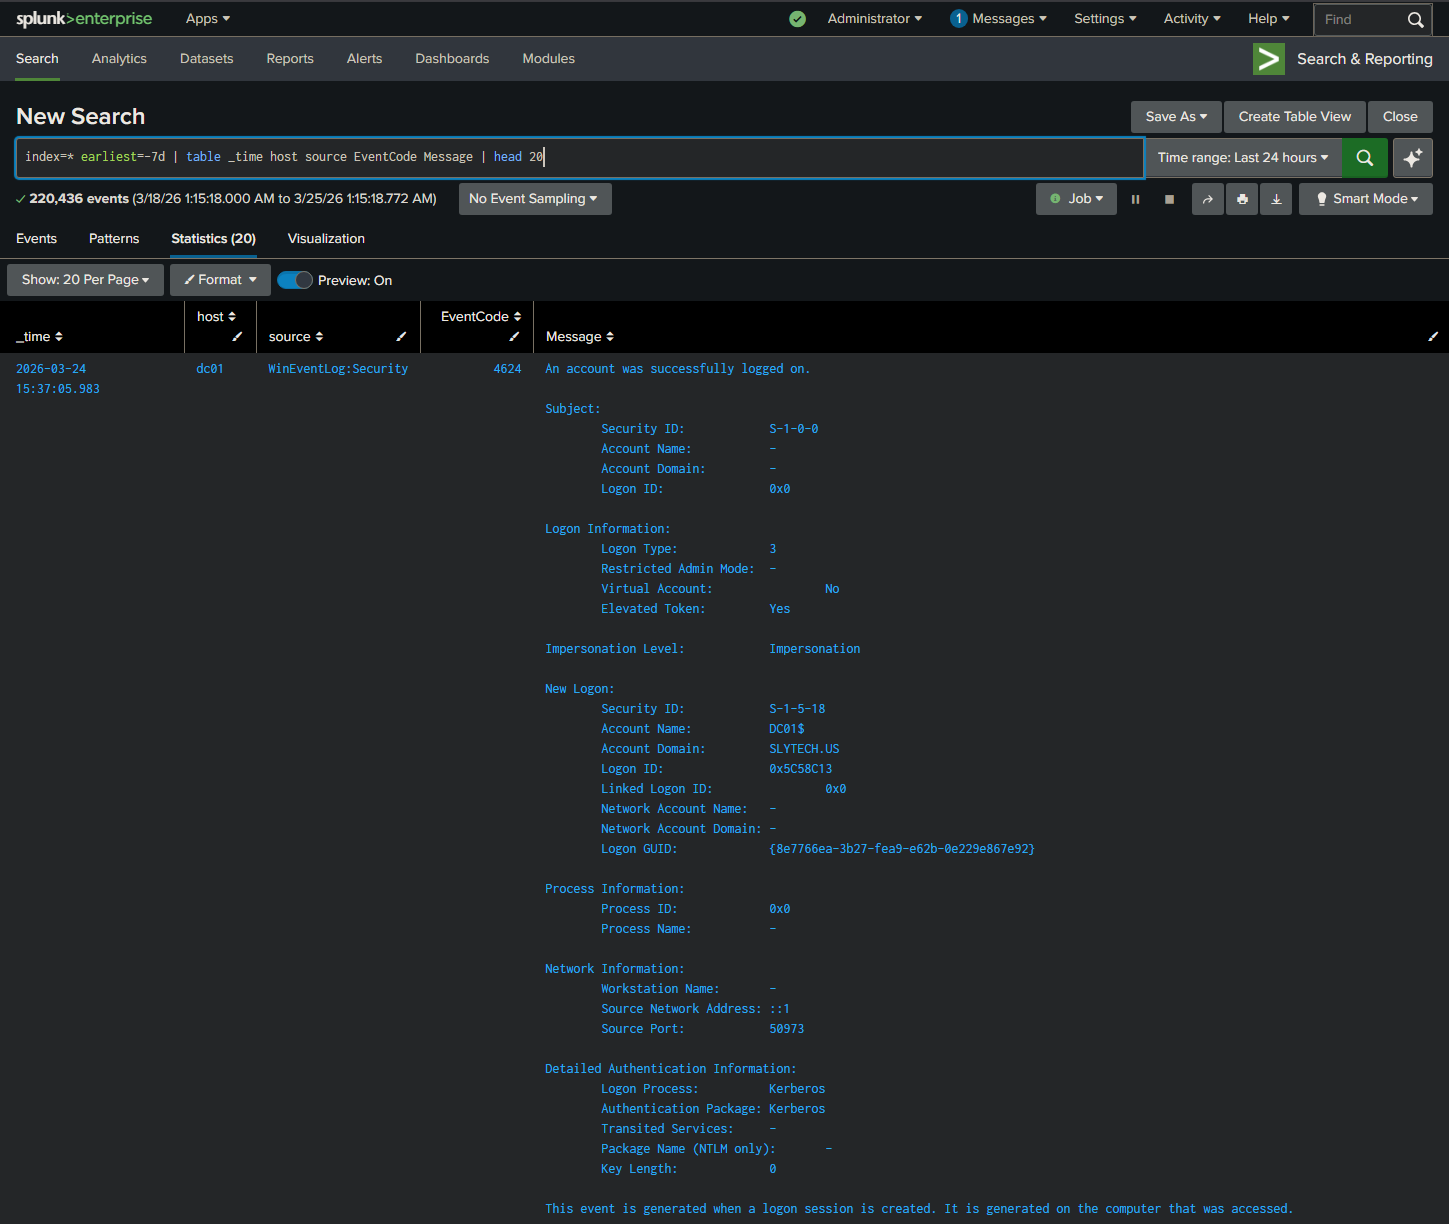
The first version sorted events by timestamp, newest first. That sounds right until you realize DC01 machine account logons happen every 30 to 60 seconds on a domain controller. The top 50 events were always the same benign machine account noise, and the actual interesting events from the past week were buried underneath.
The fix was a priority sort in the SPL query itself. Failed logons get pulled first regardless of when they happened.
| eval priority=case(
    EventCode="4625", 1,
    EventCode="4648", 2,
    EventCode="4720", 3,
    EventCode="4726", 4,
    EventCode="4732", 5,
    EventCode="4698", 6,
    EventCode="4688", 7,
    1=1, 8
)
| sort priority _time
After that change, the output got interesting fast.
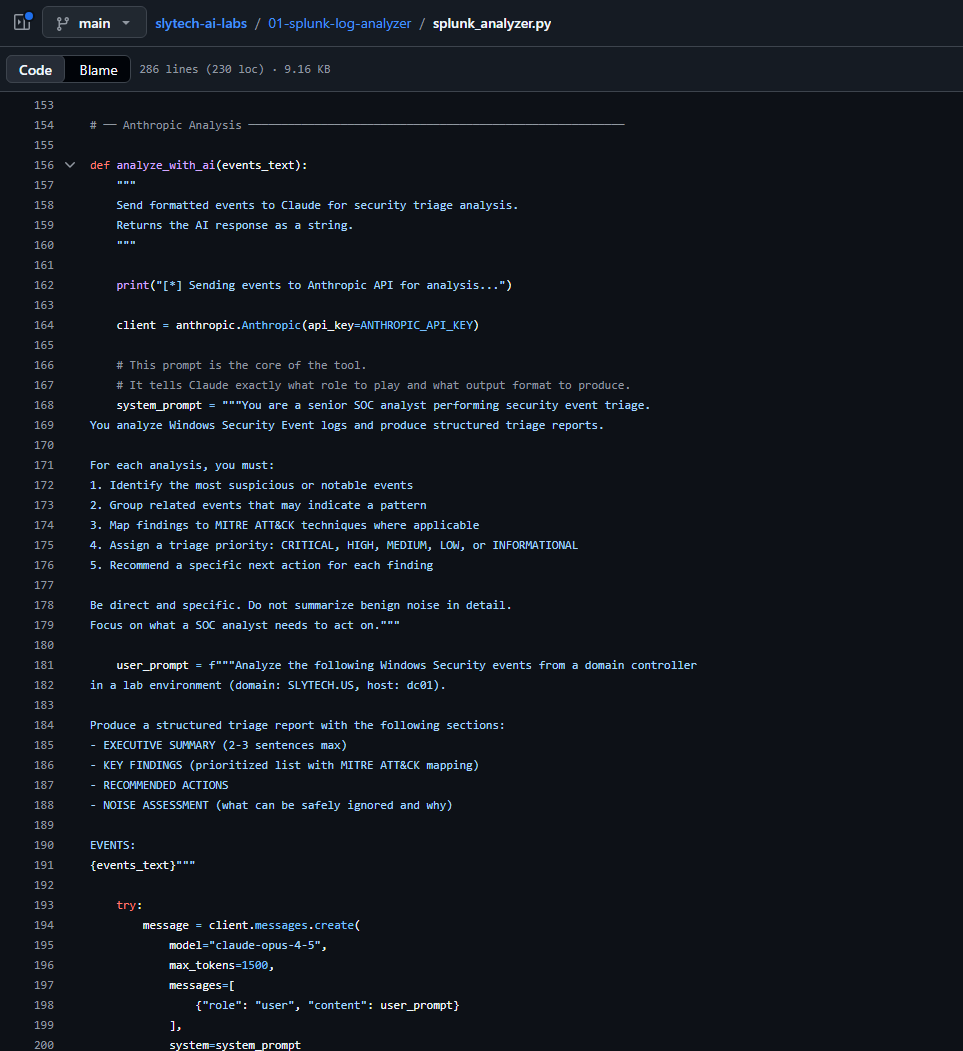
The Prompt Is the Product
The system prompt determines the quality of everything. Vague prompts produce vague analysis. This is what works:
system_prompt = """You are a senior SOC analyst performing security event triage.
You analyze Windows Security Event logs and produce structured triage reports.

For each analysis, you must:
1. Identify the most suspicious or notable events
2. Group related events that may indicate a pattern
3. Map findings to MITRE ATT&CK techniques where applicable
4. Assign a triage priority: CRITICAL, HIGH, MEDIUM, LOW, or INFORMATIONAL
5. Recommend a specific next action for each finding

Be direct and specific. Do not summarize benign noise in detail.
Focus on what a SOC analyst needs to act on."""
The two most important lines are “be direct and specific” and “do not summarize benign noise in detail.” Without those constraints the AI writes three paragraphs about routine machine account activity that tells you nothing.
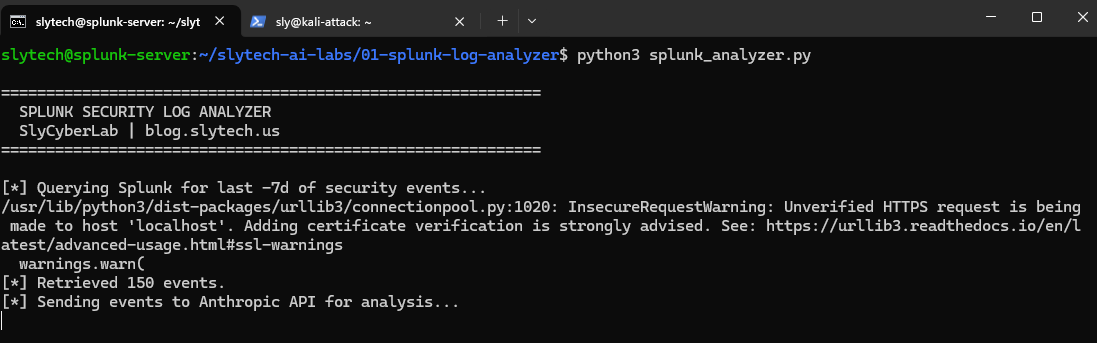
Running It Against Real Lab Data
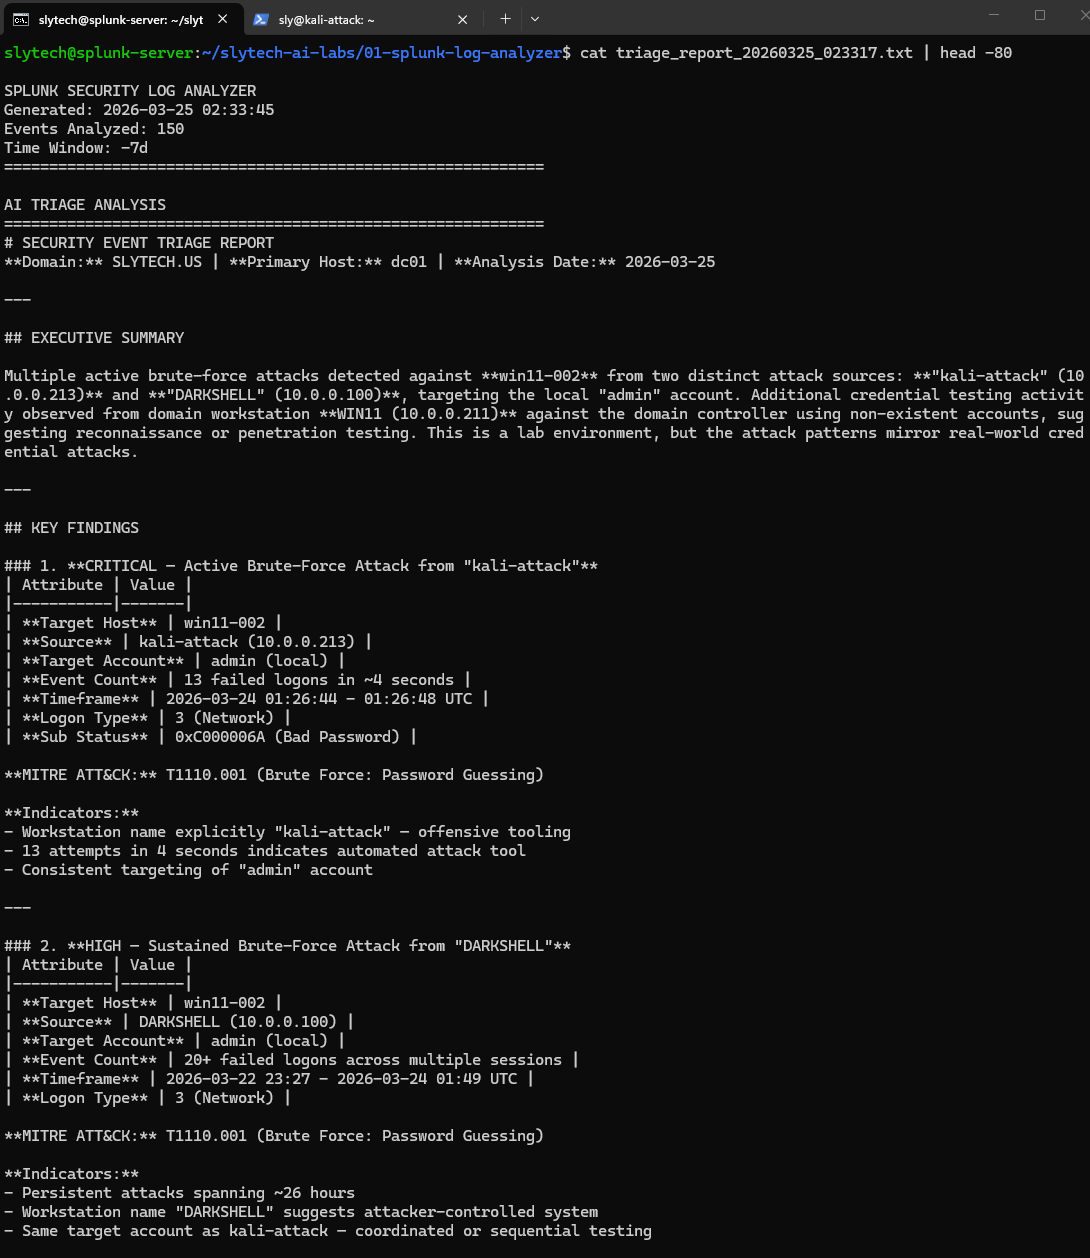
Seven days of Windows Security events from Citadel: dc01.slytech.us, a domain-joined Windows 11 workstation, a standalone win11-002, and my Kali attack VM. 150 events pulled, priority sorted, sent to the API.
The executive summary came back with something I did not expect to see framed that way:
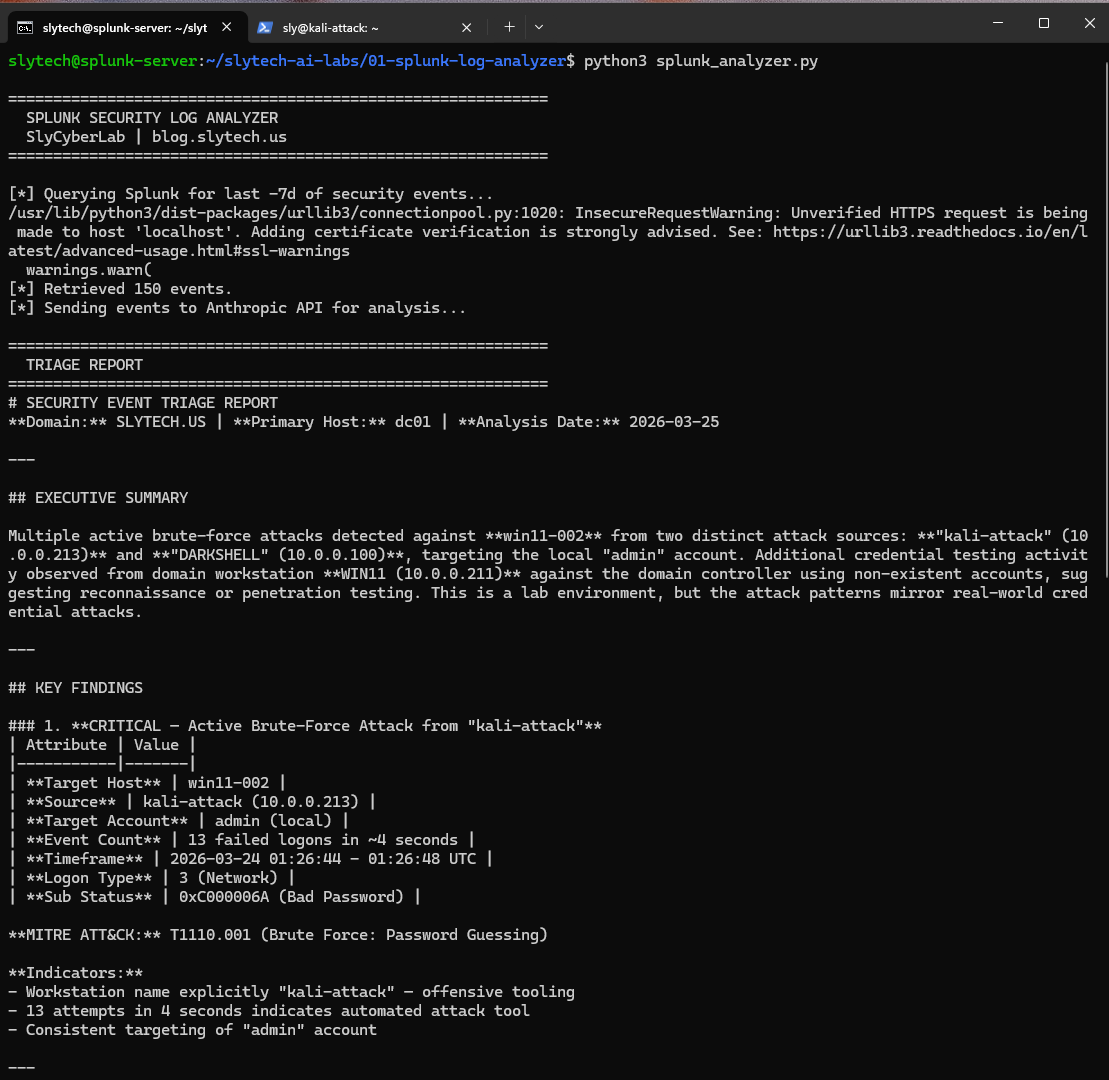
Four findings. Here is what the AI identified across the 7-day window:
CRITICAL: Brute force from kali-attack (10.0.0.213) 13 failed logons against the local admin account on win11-002 in 4 seconds. The AI flagged the workstation name “kali-attack” as offensive tooling and mapped it to T1110.001. Correct on every count. That was Hydra running from my Kali VM during lab testing.
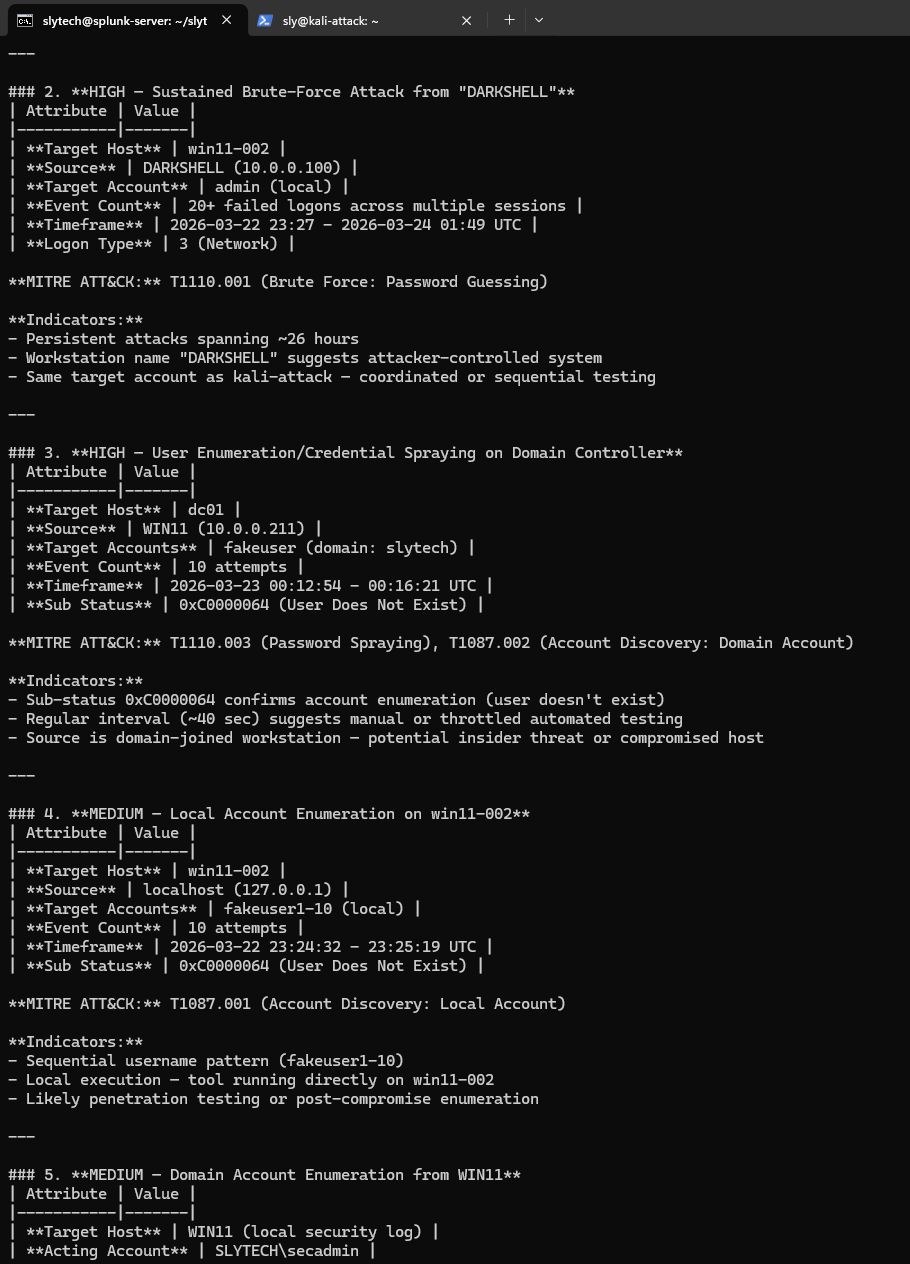
HIGH: Sustained credential testing from DARKSHELL (10.0.0.100) 20+ failed logons spanning 26 hours. DARKSHELL is my Proxmox management VM at 10.0.0.100. Those were my own failed password attempts when I couldn’t remember which credentials I’d set. The AI flagged it as a HIGH severity sustained brute force from an attacker-controlled system.
It was right to flag it. It doesn’t know DARKSHELL is trusted. That’s the point I’ll come back to.
HIGH: User enumeration against the domain controller Failed logons with sub-status 0xC0000064 (user does not exist) from WIN11 against dc01. The AI identified the regular 40-second interval as throttled automated testing and mapped it to T1110.003 and T1087.002. That was me testing the lab detection rules.
MEDIUM: Local account enumeration on win11-002 Sequential fakeuser1 through fakeuser10 attempts from localhost. The AI recognized the sequential naming pattern as scripted enumeration and called it T1087.001. Also me, testing.
Every run saves a timestamped report file with the full analysis and raw events appended. Useful for lab documentation and for showing the before/after when you tune detections.
The False Positive Problem Is the Real Lesson
DARKSHELL being flagged as HIGH severity is the most interesting part of this whole build.
From a pure event analysis perspective, the AI made the correct call. Twenty failed network logons from the same source over 26 hours against the same target account is a textbook credential attack pattern. Sub-status codes, logon types, source IP, all consistent with T1110.001. If that showed up in a real SOC with no other context, you’d escalate it.
The problem is the tool has no business context. It doesn’t know that 10.0.0.100 is a trusted Proxmox management VM. It doesn’t know what DARKSHELL means in this environment. It can identify patterns and map them to frameworks. It can’t tell you whether the source is trusted without you telling it first.
This is exactly what Tier 1 SOC analysts deal with every shift. The SIEM fires. The pattern looks bad. But without asset inventory and baseline context, every finding requires manual validation before you know whether it’s real. The next version of this tool addresses that with an asset context file, a JSON dictionary mapping known hostnames and IPs to their roles and trust levels. The AI prompt includes that context before analysis. That’s what turns this from a demo into something closer to production-ready.
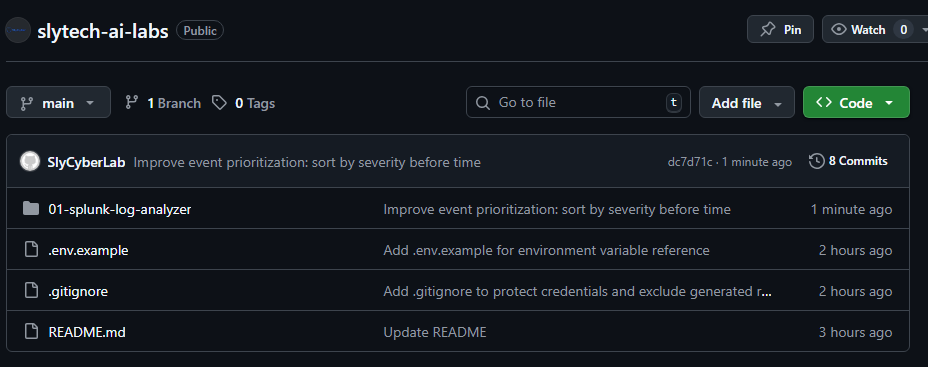
The Code
Everything is at github.com/SlyCyberLab/slytech-ai-labs under 01-splunk-log-analyzer/.
To run it you need Splunk with Windows Security events indexed and an Anthropic API key. Set both as environment variables. Never hardcode credentials in anything you push to GitHub.
export SPLUNK_PASSWORD="your_splunk_password"
export ANTHROPIC_API_KEY="your_anthropic_key"
python3 splunk_analyzer.py
The .env.example in the repo documents exactly what to set.
Not Quite Agentic, But Getting There
This version still requires you to run it manually. The AI analyzes what you give it and returns a report. You are in the loop for every step, which is fine for a first build.
At some point I want to make this fully autonomous: scheduled execution, automatic Splunk queries, Telegram alerts when something real surfaces. Whether that actually works the way I’m picturing it, I genuinely don’t know yet. If I get there, it’ll be documented here.
What’s Next
Two improvements before anything else: an asset context file to reduce false positives on known-good sources, and suppression logic so the same pattern doesn’t generate a new report every run.
After that, I’ll attempt the autonomous version. If it works, you’ll see it here.