Building a Splunk SIEM Lab on Proxmox, Part 1: Install and Data Onboarding
I already hold the Splunk Core User certification, so I knew the product. But it was about backing up that cert with something real. A working deployment, actual Windows endpoints, actual logs flowing in. The cert gets you in the door, the lab is what you talk about once you’re inside.
This is Part 1 of a 3-part series. Part 2 covers SPL searches and correlation rules. Part 3 brings in MITRE ATT&CK mapping and a Splunk vs Wazuh comparison.
Why Build This
Splunk Enterprise offers a 60-day free trial with full functionality and a 500MB/day ingest limit. For a homelab that’s more than enough. I spun up a fresh Ubuntu Server VM on Citadel, my dedicated security lab Proxmox node, and decided to document the whole process including the parts that didn’t go smoothly. Spoiler: there were a few.
Before You Install, Check Your Disk
Splunk needs roughly 3GB on top of your base OS. I learned this the hard way during the Wazuh install.
Check your available space before you start:
df -h
If you’re tight, expand your LVM first:
sudo lvextend -l +100%FREE /dev/ubuntu-vg/ubuntu-lv && sudo resize2fs /dev/ubuntu-vg/ubuntu-lv
Installing Splunk
The VM is running Ubuntu 22.04 on Citadel. 8GB RAM, 80GB disk after the resize.
wget -O splunk-10.2.1-c892b66d163d-linux-amd64.deb "https://download.splunk.com/products/splunk/releases/10.2.1/linux/splunk-10.2.1-c892b66d163d-linux-amd64.deb"
sudo dpkg -i splunk-10.2.1-c892b66d163d-linux-amd64.deb
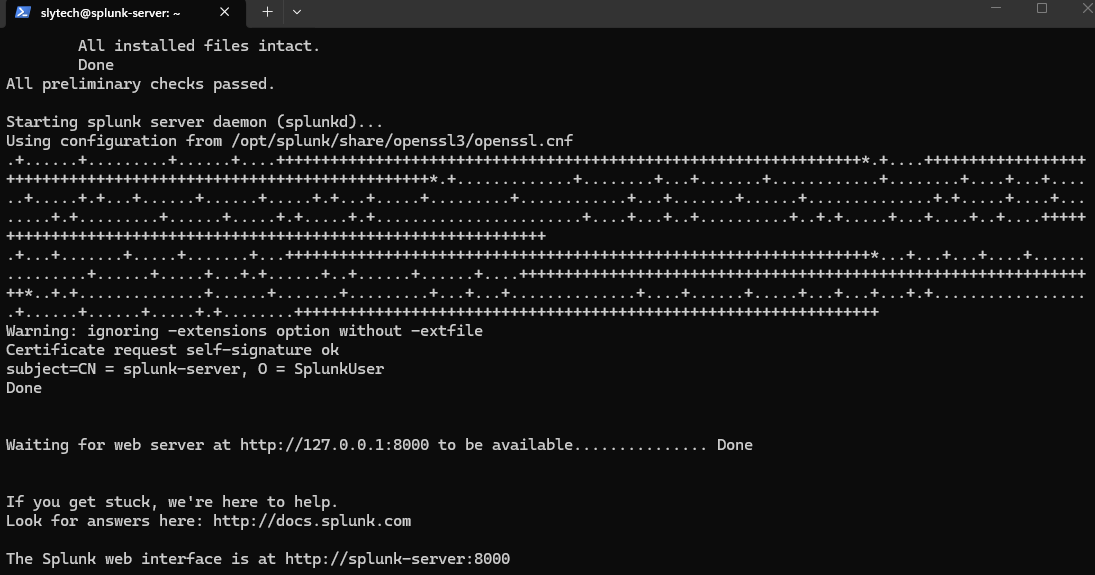
sudo /opt/splunk/bin/splunk start --accept-license --run-as-root
The --accept-license flag skips the interactive prompt and --run-as-root is required on Ubuntu since running Splunk as root is technically deprecated but still works fine for a lab setup. This installs everything on a single node, manager, indexer, and dashboard all on the same box. Right for a homelab, wrong for production.
When the install finishes it prints your admin credentials directly in the terminal. Screenshot that immediately, it only appears once. Then Splunk starts and gives you the web interface URL.
Enable boot-start so it comes back up after a reboot:
sudo /opt/splunk/bin/splunk enable boot-start --run-as-root
First Login
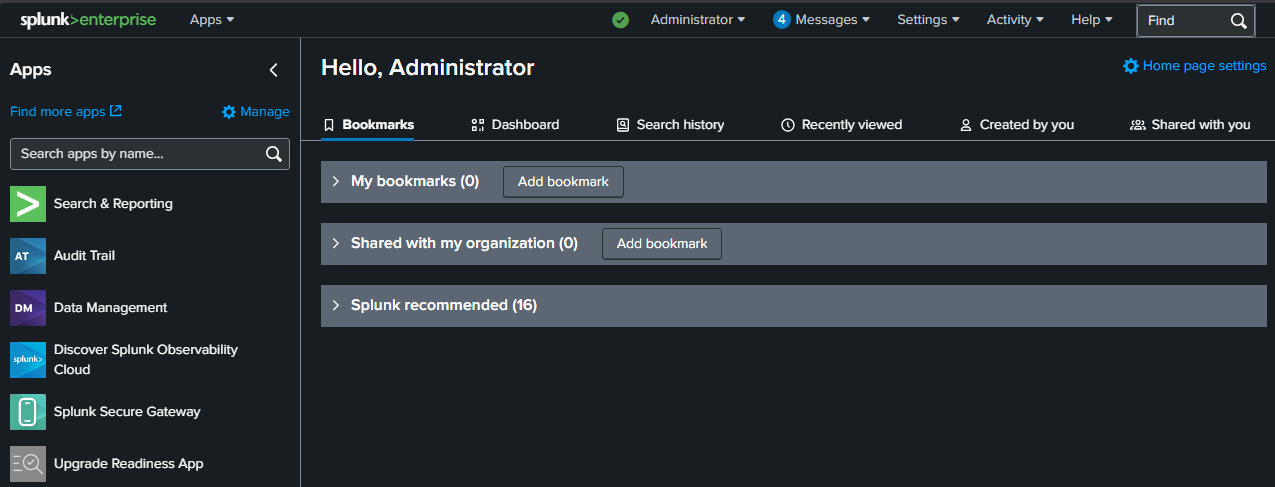
Head to http://your-splunk-ip:8000 and log in. The dashboard loads right away and already shows activity from the Splunk server monitoring itself. Even before connecting any endpoints, you can already see events coming in.
Setting Up the Receiving Port
Before any forwarder can send data, Splunk needs to be listening for it. Think of this like opening a door. Without this step, forwarders will connect but nothing will come through.
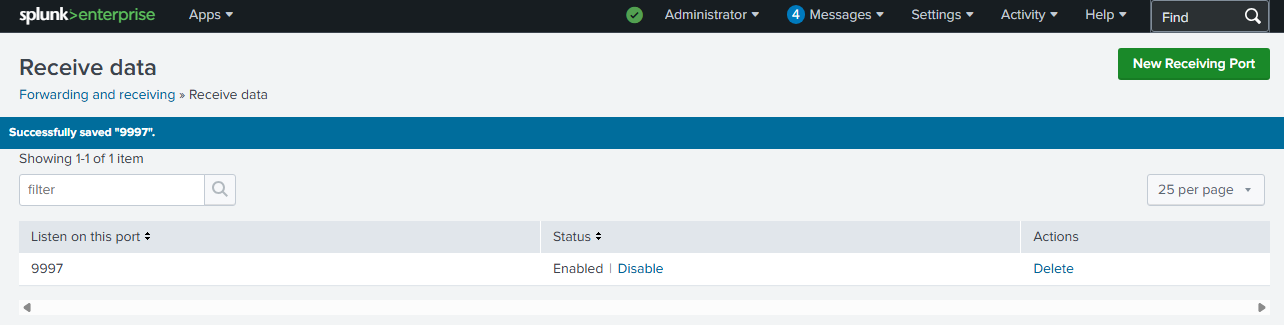
Go to Settings → Forwarding and receiving → Configure receiving → New Receiving Port and add port 9997. That’s the standard port Splunk Universal Forwarders use by default.
Installing Universal Forwarders on Windows
The lab has two Windows endpoints. dc01 is a domain controller at 10.0.0.210 and win11-002 is a standalone workstation at 10.0.0.181. Both are on the same flat network as the Splunk server at 10.0.0.228.
The Universal Forwarder is a lightweight agent you install on each machine you want to monitor. It collects logs and ships them to Splunk over port 9997. On each Windows machine, run this in PowerShell:
Invoke-WebRequest -Uri "https://download.splunk.com/products/universalforwarder/releases/10.2.1/windows/splunkforwarder-10.2.1-c892b66d163d-windows-x64.msi" -OutFile "C:\splunkforwarder.msi"

msiexec.exe /i "C:\splunkforwarder.msi" RECEIVING_INDEXER="10.0.0.228:9997" WINEVENTLOG_SEC_ENABLE=1 WINEVENTLOG_SYS_ENABLE=1 WINEVENTLOG_APP_ENABLE=1 AGREETOLICENSE=Yes /quiet
Then create two config files. The outputs.conf tells the forwarder where to send data:
$outputs = "[tcpout]`r`ndefaultGroup = splunk-server`r`n`r`n[tcpout:splunk-server]`r`nserver = 10.0.0.228:9997"

[System.IO.File]::WriteAllText("C:\Program Files\SplunkUniversalForwarder\etc\system\local\outputs.conf", $outputs)
The inputs.conf tells it what to collect:
$inputs = "[WinEventLog://Security]`r`nindex = main`r`ndisabled = 0`r`nstart_from = oldest`r`ncurrent_only = 0`r`ncheckpointInterval = 5`r`n`r`n[WinEventLog://System]`r`nindex = main`r`ndisabled = 0`r`n`r`n[WinEventLog://Application]`r`nindex = main`r`ndisabled = 0"

[System.IO.File]::WriteAllText("C:\Program Files\SplunkUniversalForwarder\etc\system\local\inputs.conf", $inputs)

Restart-Service SplunkForwarder
The Domain Controller Problem I Didn’t Expect
This is where it got interesting. On dc01, Application and System logs started flowing into Splunk right away. Security logs were a different story.
I kept generating failed login attempts and searching for EventCode 4625 (the standard Windows failed logon event) and getting nothing. The events were showing up in Windows Event Viewer, but not in Splunk. After a lot of troubleshooting I figured out two things.
First, there was a CIS Baseline Policy still applied to dc01 from a previous compliance lab I had built. It was interfering with the audit configuration. Removing it fixed the audit policy conflict.
Second, and this is the bigger lesson: domain controllers use Kerberos by default. When a failed login happens on a DC, it often generates EventCode 4771 (Kerberos pre-authentication failure) rather than 4625. The classic 4625 event only appears reliably when NTLM authentication is used. On a standalone workstation that’s the default. On a domain-joined machine talking to a DC, it’s Kerberos.
This is why the lab includes win11-002 as a standalone workstation. For straightforward 4625 detection, it’s the cleaner target.
Data Flowing
With both forwarders running, a quick search confirms what’s coming in:
index=main | stats count by host
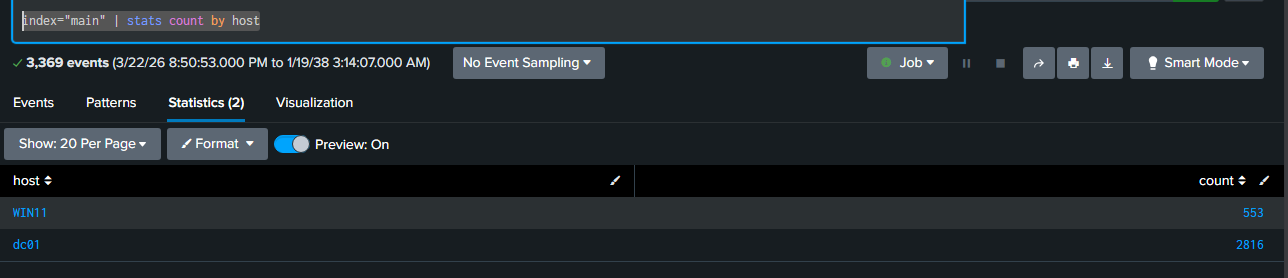
WIN11 has 553 events and dc01 has 2,816. Both are online and shipping logs.
Catching Failed Logons
To test detection I made deliberate failed RDP login attempts against win11-002 from DarkShell, my Windows VM. The forwarder picked them up within about a minute.
index=main sourcetype=WinEventLog:Security EventCode=4625

16 events. EventCode 4625, ComputerName win11-002. The interesting fields panel on the left already parsed out Failure_Reason, Workstation_Name, Account_Name, and Source_Network_Address automatically. That’s Splunk doing what it’s built to do.
What I Took Away From This
The install itself is straightforward once you sort out the disk space. The real learning was around how Windows authentication works in a domain environment and why the logs you expect don’t always show up the way you think they will. The difference between Kerberos and NTLM authentication, and how that changes which EventCodes get generated, is the kind of thing that only clicks when you’re actually staring at an empty search result trying to figure out why.
That’s the point of building this stuff. The cert tells you what the concepts are. The lab is where you actually understand them.
What’s Next
Part 2 covers SPL searches in depth, building correlation rules, and a dashboard that turns raw events into something readable. If you run into the same Kerberos vs NTLM issue I hit, Part 2 will cover how to search for both event types properly.