Building a Splunk SIEM Lab on Proxmox, Part 2: SPL Searches, Alerts, and Dashboards
Part 1 got Splunk running with Universal Forwarders on two Windows endpoints. Logs were flowing. But staring at a raw event stream isn’t detection engineering, it’s just data collection. Part 2 is where the actual work starts.
This is the phase where I went from “I have logs” to “I have detections.” By the end of this post I had a brute force alert running every 5 minutes and a dashboard that tells a story at a glance.
Start With a Data Inventory
Before writing a single detection, I wanted to understand exactly what I was working with. This is something SOC analysts do before touching alerts. You can’t detect anomalies if you don’t know what normal looks like.
The first search I ran was a simple inventory:
index=main | stats count by host sourcetype | sort -count
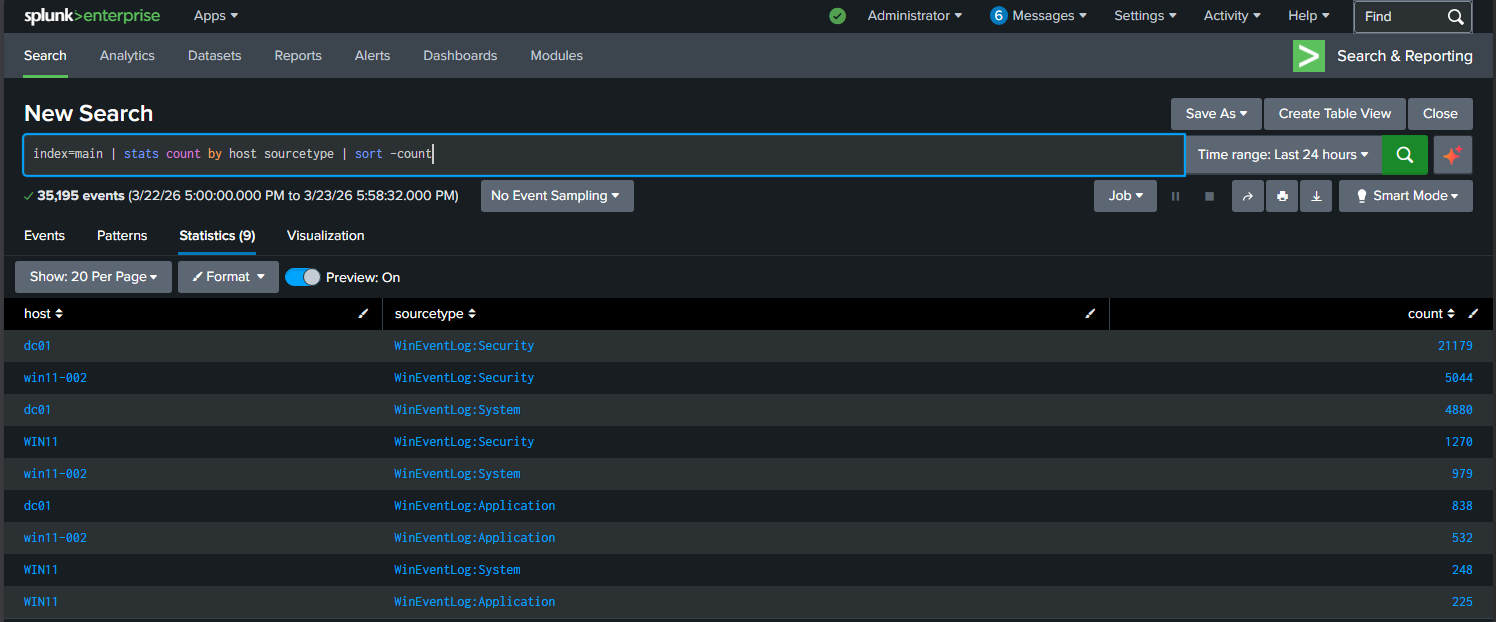
227,485 events across 7 days. Three hosts sending data, dc01 dominating with the bulk of it. This one search told me where my data was coming from and how much of it existed before I wrote anything else.
Next I wanted to know which Windows Security EventCodes were actually present:
index=main sourcetype=WinEventLog:Security | stats count by EventCode | sort -count | head 15
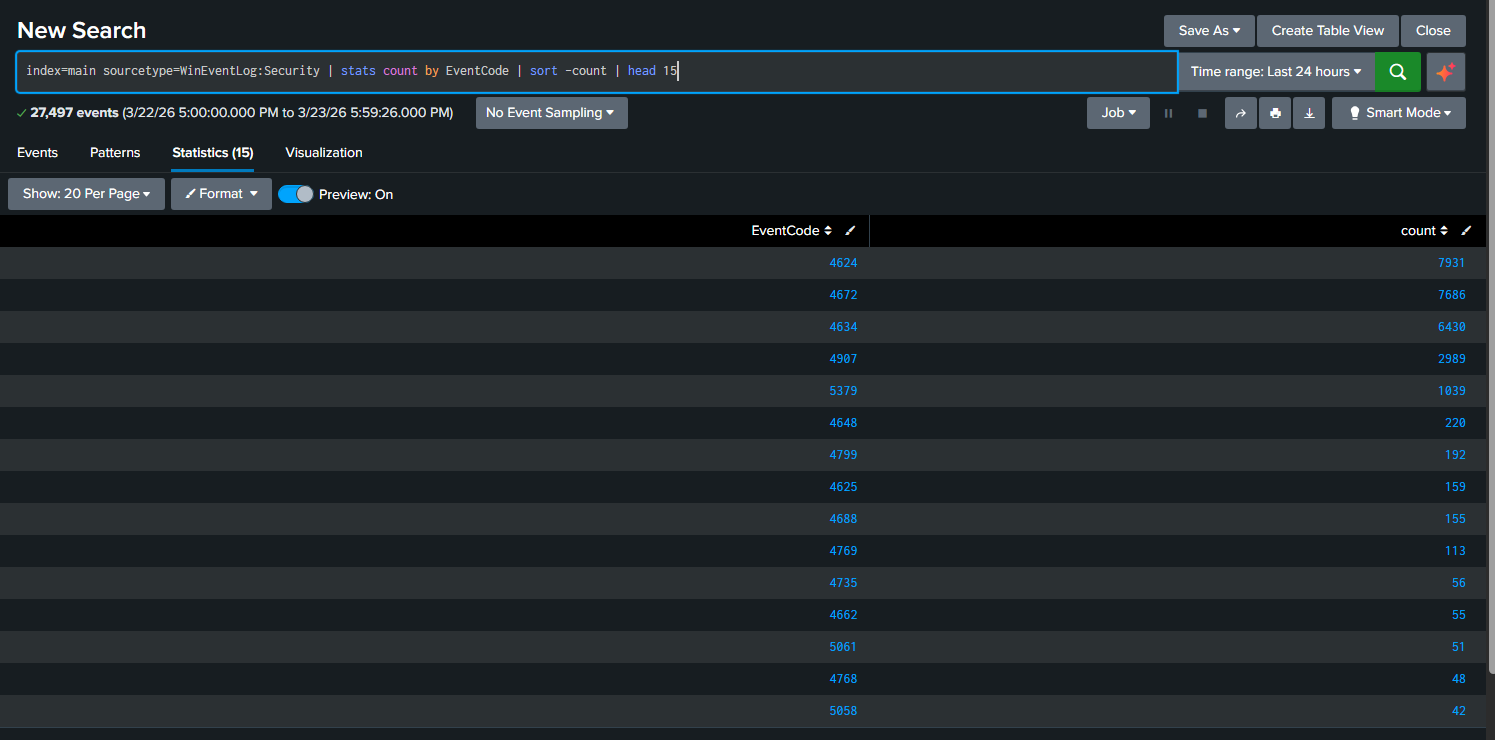
The top three were 4624 (successful logon), 4634 (logoff), and 4672 (special privileges assigned). Those three account for the vast majority of the Security log. That’s normal for a domain controller. The interesting ones are buried further down, and 4625 (failed logon) was sitting at 159 events. That’s what I wanted to build a detection around.
Writing the First Real Detection
A junior analyst might just search for EventCode=4625 and call it a day. That’s not detection engineering, that’s filtering. A real brute force detection needs context: who failed, on which machine, from where, and how many times in a short window.
Here’s the search I built:
index=main sourcetype=WinEventLog:Security EventCode=4625
| bin _time span=5m
| stats count by _time host Account_Name Source_Network_Address
| where count >= 3
| sort -count
Let me break down what each piece does, because this pattern shows up in SOC work constantly.
bin _time span=5m groups all events into 5-minute buckets. Without this, you’re counting totals over the whole time range, which is useless for detecting bursts of activity.
stats count by _time host Account_Name Source_Network_Address gives you who is failing (Account_Name), on which machine (host), from where (Source_Network_Address), and when (grouped into those 5-minute buckets).
where count >= 3 is the threshold. Three failures in five minutes is suspicious. One failure might be a typo. Three is a pattern. SOC teams tune this number per environment, but 3 is a reasonable starting point for a lab.
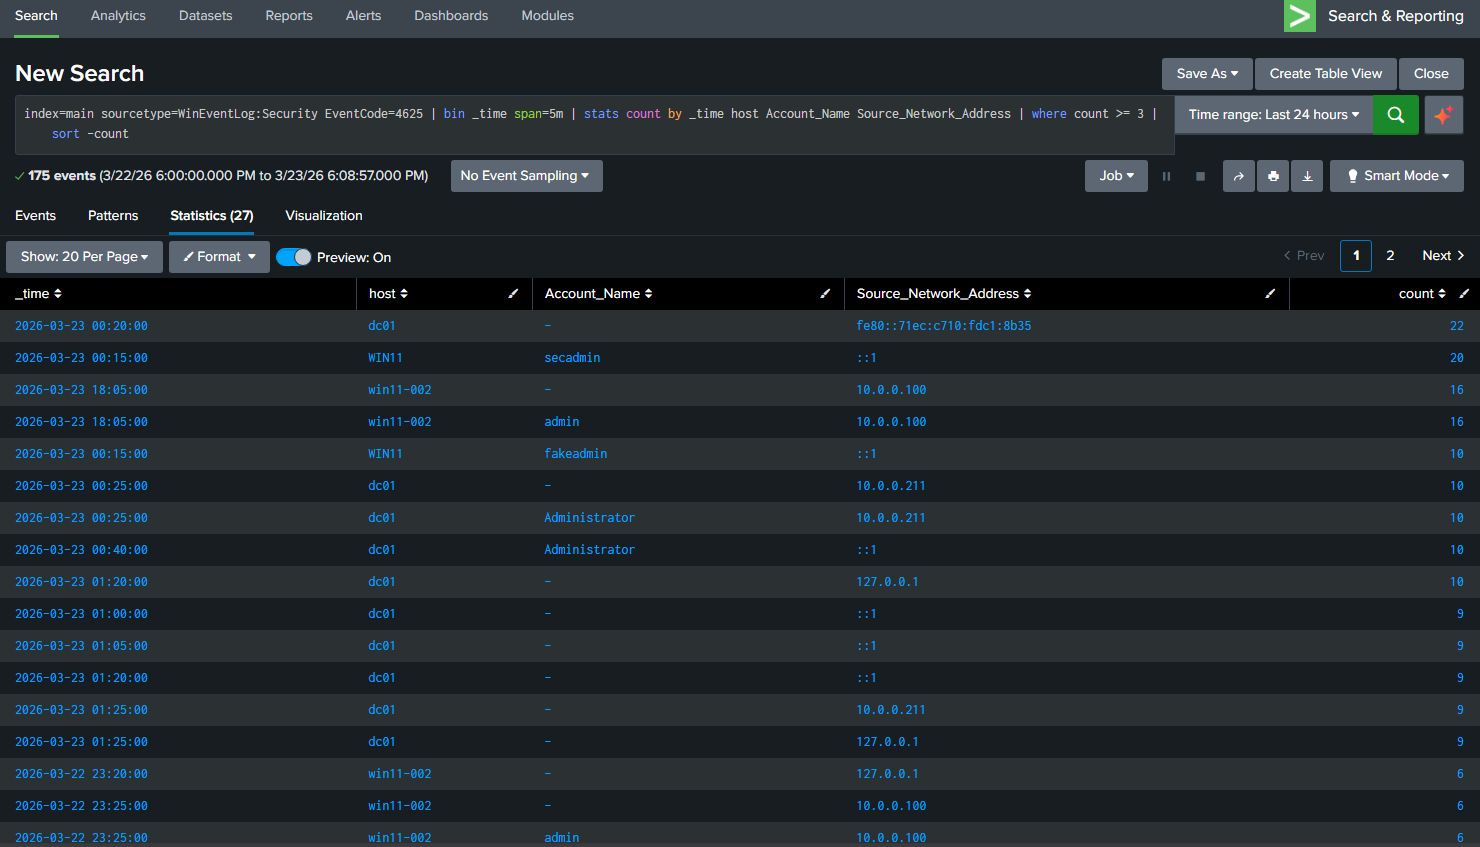
The results showed exactly what I expected. My test accounts hitting win11-002 multiple times, the administrator account being targeted from 10.0.0.211, and the loopback address attempts from the NTLM testing I ran in Part 1. Real data, real detections.
Turning the Search Into an Alert
Running a search manually is fine for investigation. For detection you need something that runs automatically and tells you when it fires.
From the search results I clicked Save As → Alert and configured it:
- Title: Brute Force - Multiple Failed Logons
- Schedule: Every 5 minutes using cron expression
*/5 * * * * - Trigger condition: Number of results is greater than 0
- Action: Add to Triggered Alerts
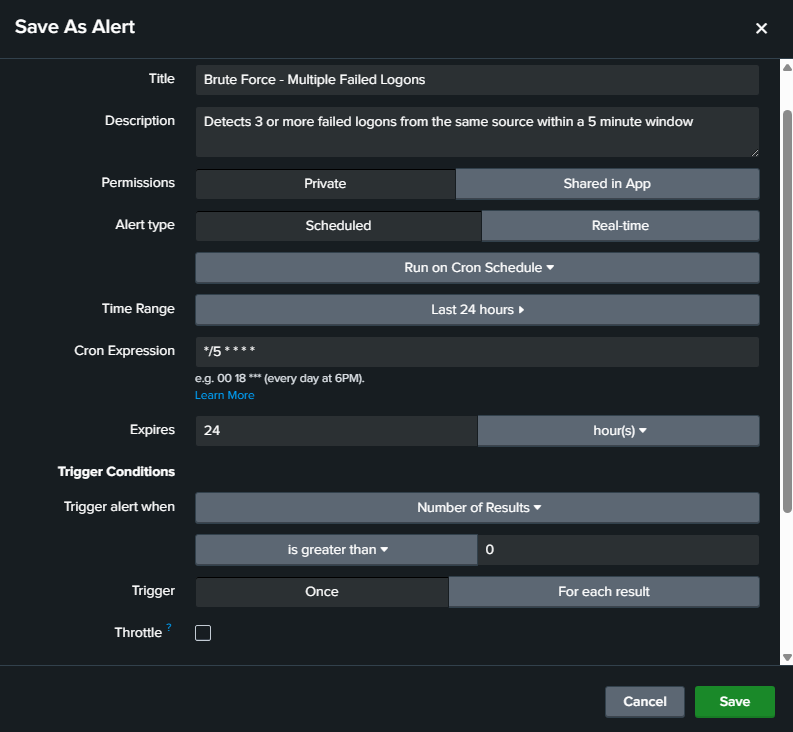
The cron expression */5 * * * * means run every 5 minutes, every hour, every day. It matches the 5-minute window in the SPL search, so the alert checks the exact same timeframe it’s searching over.
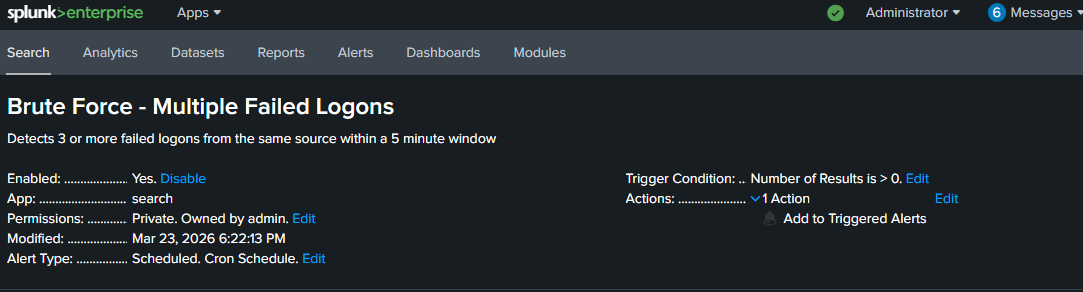
The alert is now live. Every 5 minutes Splunk runs that search. If any source generates 3 or more failed logons in a 5-minute window it fires and logs to Triggered Alerts. That’s a detection running in the background without me touching anything.
Building the Dashboard
A detection that only lives in the Alerts tab isn’t useful during an investigation. I wanted a single view that shows the security posture of the lab at a glance. Four panels, each answering a specific question.
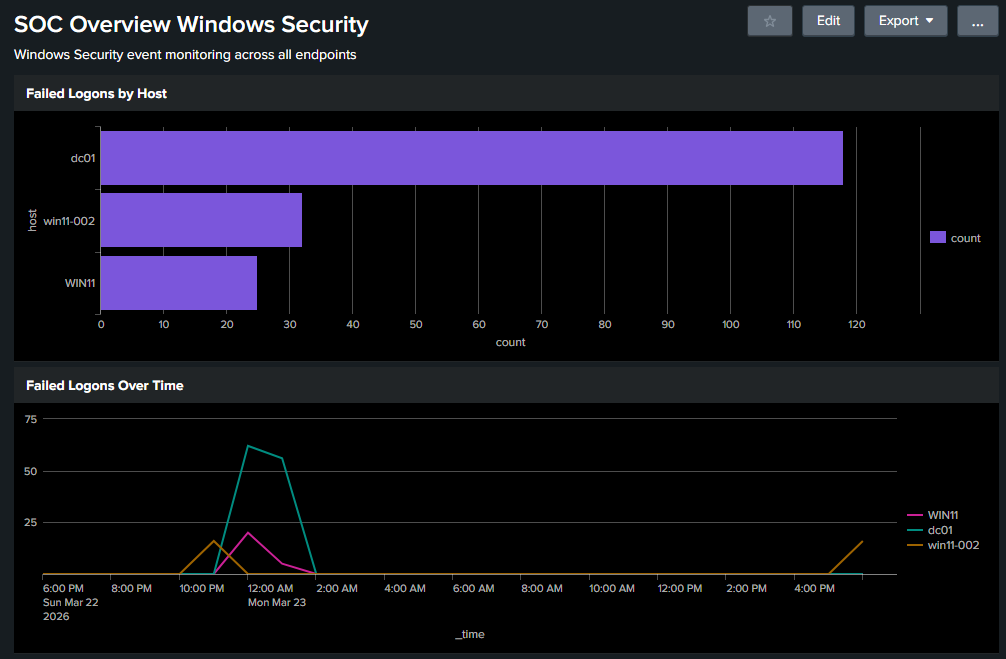
Panel 1: Failed Logons by Host
index=main sourcetype=WinEventLog:Security EventCode=4625 | stats count by host | sort -count
Answers: which machine is being targeted most.
Panel 2: Failed Logons Over Time
index=main sourcetype=WinEventLog:Security EventCode=4625 | timechart span=1h count by host
Answers: when did the failures spike and on which host.
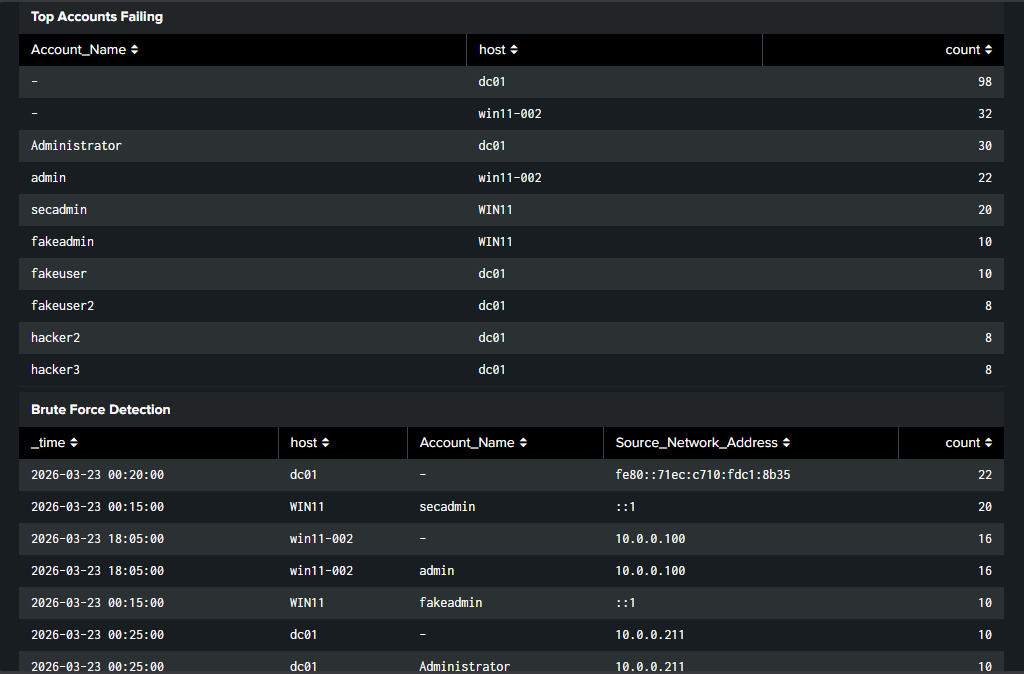
Panel 3: Top Accounts Failing
index=main sourcetype=WinEventLog:Security EventCode=4625 | stats count by Account_Name host | sort -count | head 10
Answers: which accounts are being targeted, real or fake.
Panel 4: Brute Force Detection
index=main sourcetype=WinEventLog:Security EventCode=4625 | bin _time span=5m | stats count by _time host Account_Name Source_Network_Address | where count >= 3 | sort -count
Answers: is there an active brute force happening right now.
Four panels, four questions answered without running a single manual search. That’s the point of a dashboard.
What I Took Away From This
The searches themselves aren’t complicated. The thinking behind them is what matters. Understanding why you bin by time instead of counting totals, why you include the source address, why you set a threshold instead of alerting on every failure, that’s the detection engineering mindset.
Building this in a lab with real data makes that thinking stick in a way that no course or certification can replicate. I ran the attacks, I saw the events, I built the detection that would have caught them.
What’s Next
Part 3 closes the loop by mapping these detections to MITRE ATT&CK using the Splunk Security Essentials app, cloning and customizing the detection for the Citadel lab, and tying the whole series together into a complete SOC workflow.