Setting Up Wazuh SIEM in My Homelab
If you’re running a homelab and want to get into security monitoring without spinning up a full enterprise stack, Wazuh is one of the best starting points. It’s open source, actively maintained, and mirrors what you’d actually use in a real SOC environment. I’ve had it running for about three months now and it’s become one of the most valuable tools in my setup.
Why Wazuh
Most SIEM solutions are either too heavy for a homelab or locked behind a paywall. Wazuh hits the sweet spot, it gives you host-based intrusion detection, log analysis, vulnerability detection, file integrity monitoring, and compliance assessment all in one package, for free.
Before You Install, Talk About Disk Space
This is the part most blog posts skip and it’ll waste your afternoon if you ignore it. Wazuh installs three components, the manager, the indexer, and the dashboard. The dashboard package alone is close to 1GB, and by the time everything is installed you’re looking at roughly 3GB just for Wazuh on top of your OS.
Check your available space before you start:
df -h
If you’re running tight, expand your LVM first:
sudo lvextend -l +100%FREE /dev/ubuntu-vg/ubuntu-lv && sudo resize2fs /dev/ubuntu-vg/ubuntu-lv
I learned this the hard way when the dashboard installation failed mid-install and rolled everything back. Save yourself the frustration.
Installing Wazuh
I’m running Wazuh on a dedicated Ubuntu Server VM on Citadel, my Proxmox cybersecurity lab. If you want to follow along with the VM setup, check out my previous post on spinning up Ubuntu Server on Proxmox.
The install command uses the official Wazuh quick installer with the -a flag, which stands for all-in-one. It deploys the manager, indexer, and dashboard on a single node, which is exactly what you want for a homelab setup.
curl -sO https://packages.wazuh.com/4.11/wazuh-install.sh && sudo bash ./wazuh-install.sh -a
It takes about 10-15 minutes. When it finishes it prints your admin credentials directly in the terminal. Screenshot that immediately, it only shows once.
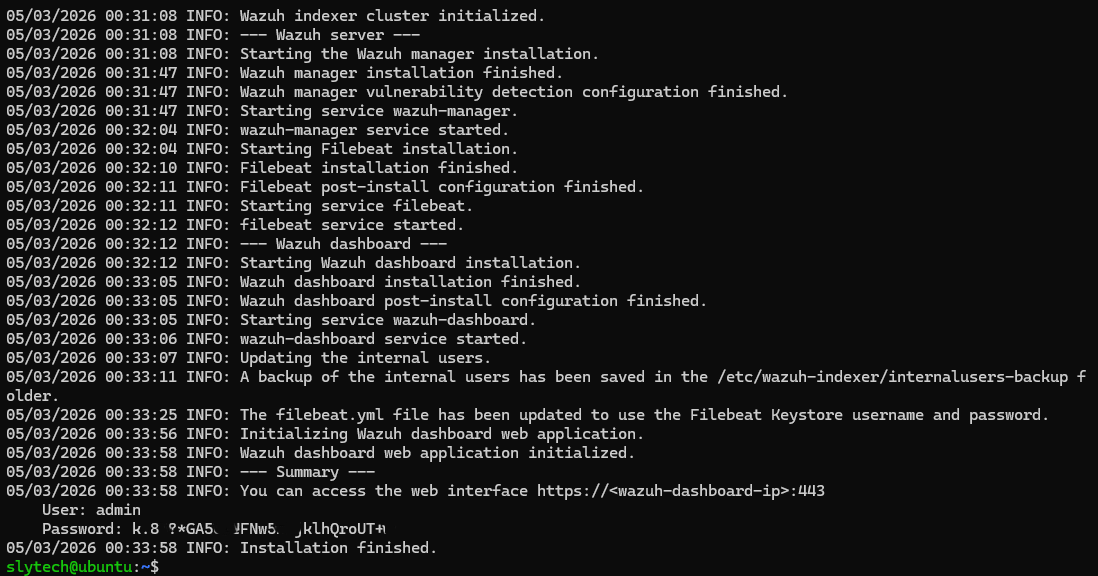
First Login
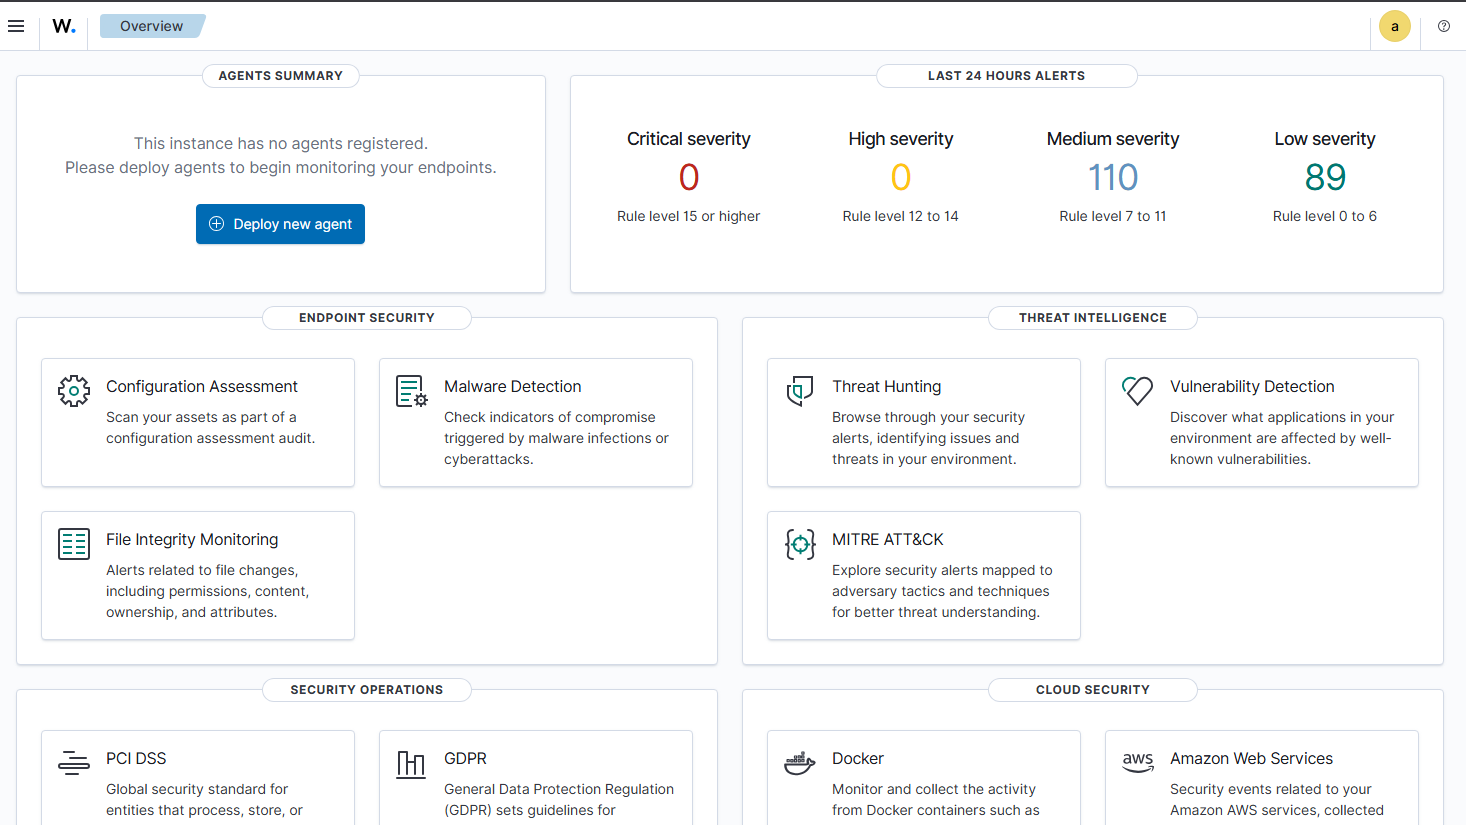
Head to https://<your-server-ip> in your browser. You’ll get a certificate warning since it’s self-signed, just click through it. Log in with the admin credentials from the install output and you’re in.
The dashboard already shows activity even before you connect any agents. It’s monitoring the Wazuh server itself, so you’ll see alerts firing right away.
Adding Agents
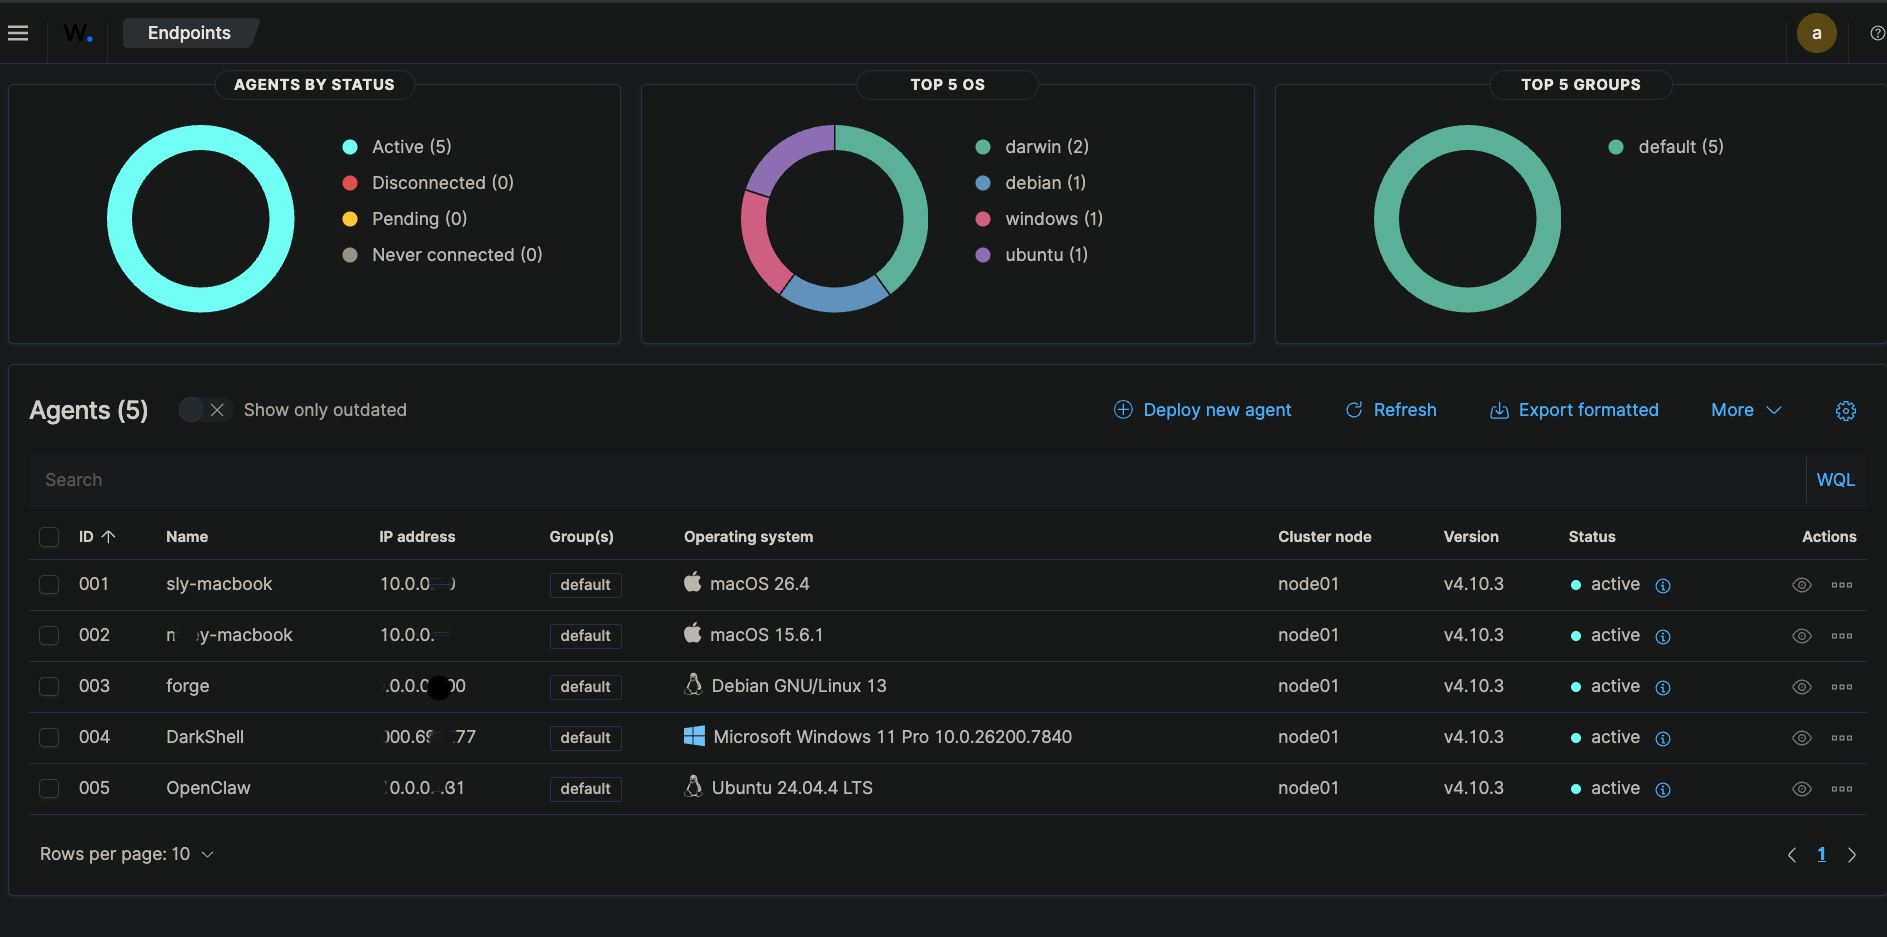
Click Deploy new agent in the dashboard and follow the prompts for your OS. Wazuh generates the install command for you with your server address pre-filled, you just run it on the endpoint and start the service.
Right now I’m monitoring five endpoints across my homelab, two Macs, my main Proxmox server Forge, DarkShell my Windows VM, and OpenClaw my autonomous AI agent box. Each one connected without any issues.
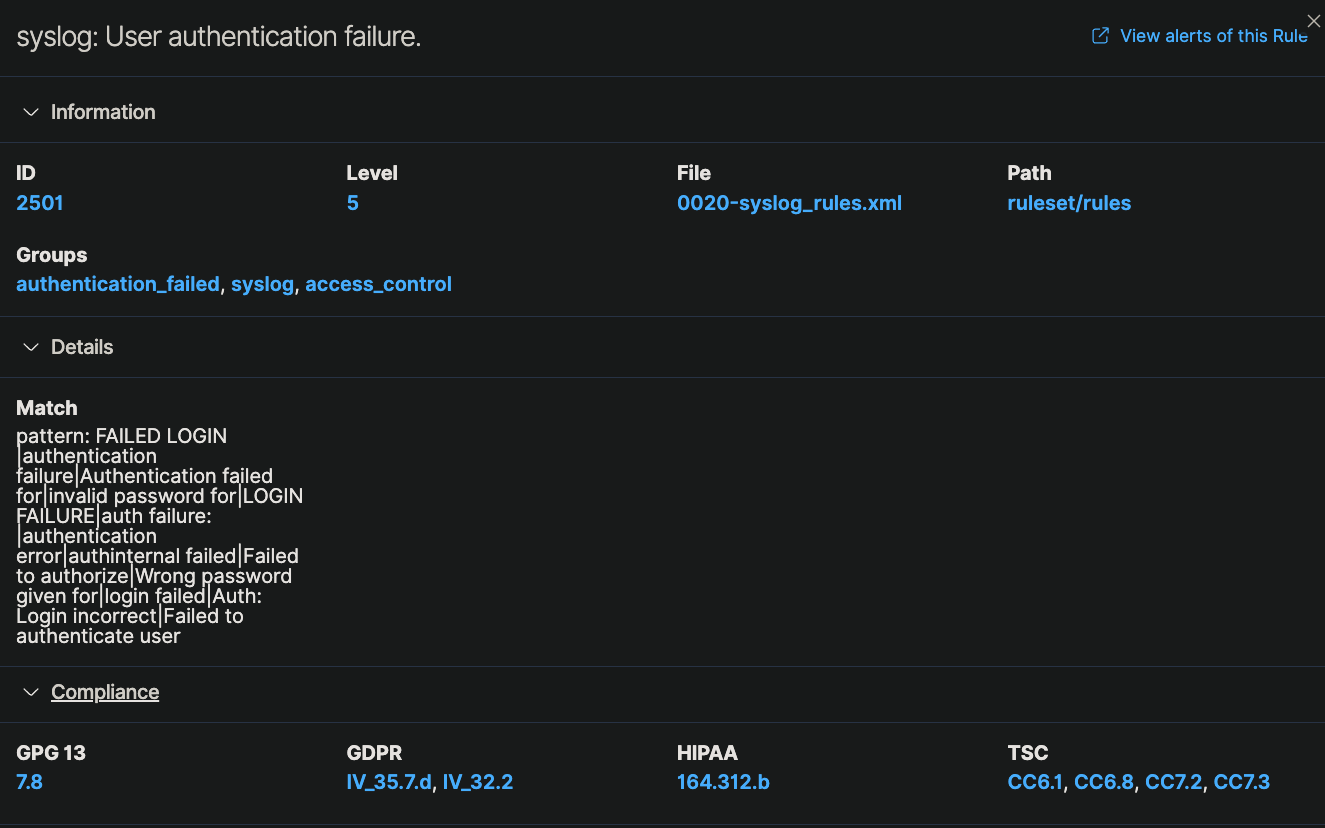
Catching Real Events
To test detection I ran deliberate failed SSH login attempts against Forge. Wazuh caught them and logged them alongside everything else it was already tracking. Over 30 days on Forge alone it recorded 1,427 total events, 106 authentication failures, and 262 successful authentications.
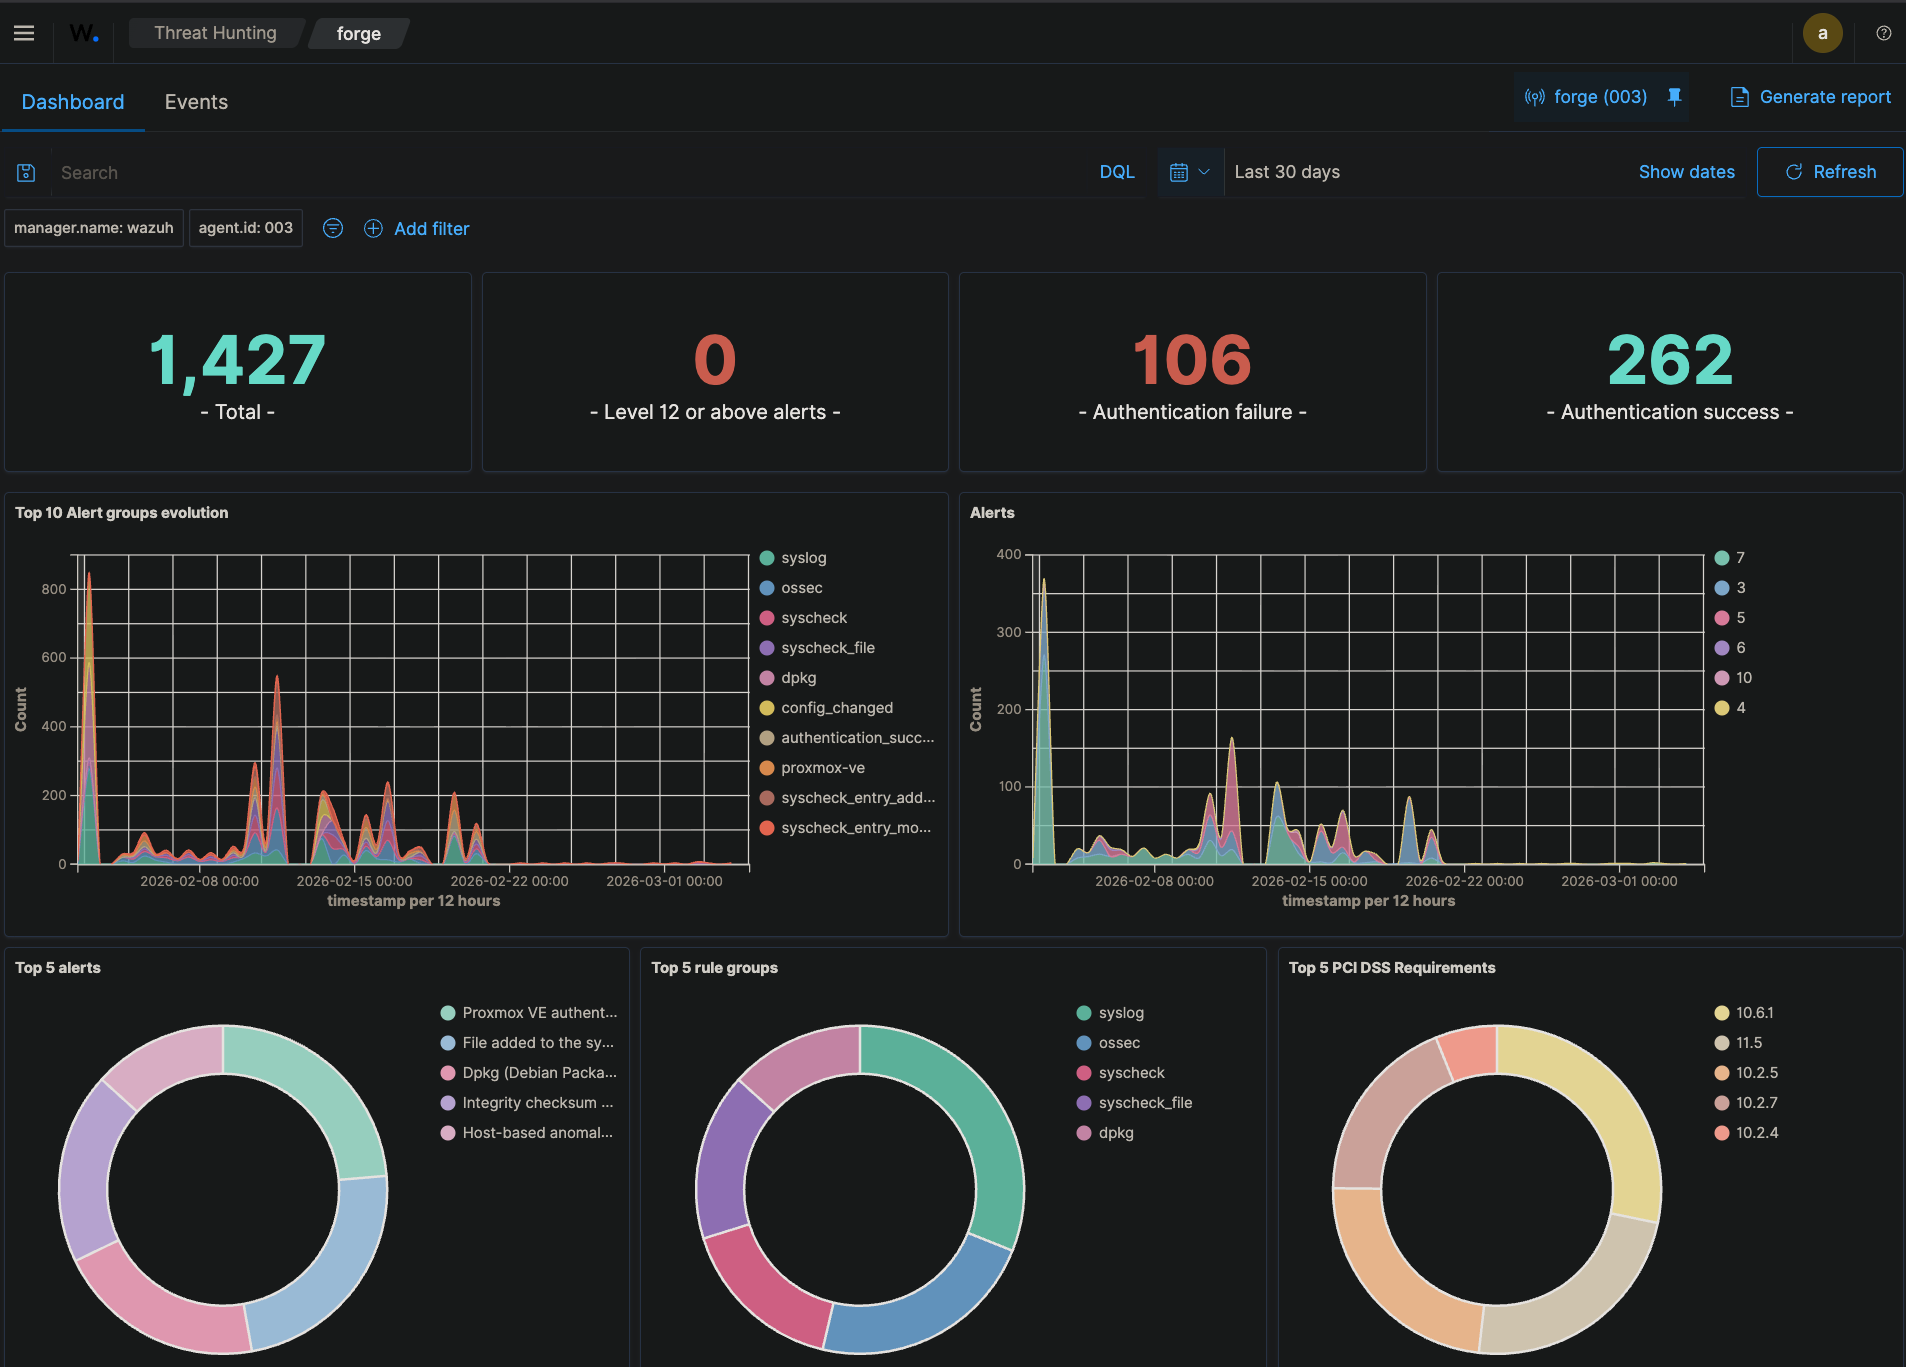
Seeing your own activity show up as security events makes the whole thing click in a way that reading about SIEMs never does.
What’s Next
I’m planning to build out a Grafana dashboard pulling from Wazuh data and add agents to any new VMs that come online. The goal long term is a unified monitoring view across the entire homelab.
If you’re sitting on a Proxmox box and haven’t set up any security monitoring yet, Wazuh is worth an afternoon of your time.