Building an Identity Governance and Drift Monitoring Portal on Microsoft Graph
How I built a read-only identity governance layer with an AI Copilot on top of my existing lifecycle automation, using PowerShell, Microsoft Graph, Azure Functions, and Claude to surface drift, privileged access changes, and compliance gaps.
Most identity automation projects stop at provisioning. You build the onboarding script, the offboarding script, wire them up to a form, and call it done. I did exactly that in my Identity Lifecycle Automation project. But after running it for a few weeks I kept asking the same questions. Who has Global Administrator right now? Which accounts got disabled but still have a license burning? What actually changed since last week?
The automation handled the actions. Nothing handled the visibility. So I built the visibility layer, and then added an AI that explains what it sees. Source and scripts available on GitHub.
Why a Governance Portal Instead of More Automation
Automated remediation in an identity system is high stakes. One misconfigured rule disables the wrong account or strips a license from the wrong user and you have a real incident on your hands. The better pattern, especially in a portfolio context, is to separate detection from remediation. Build the system that sees everything clearly first. Remediation comes after you trust what you are seeing.
The Architecture
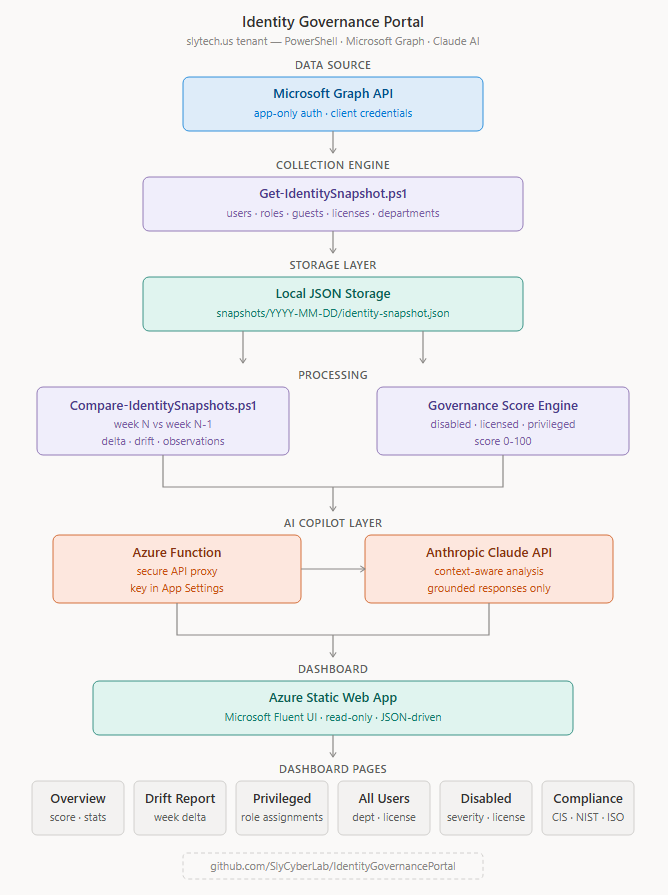
The system runs as four connected pieces. A PowerShell script pulls identity data from Microsoft Graph every week and writes a versioned JSON snapshot to disk. A second script compares the current snapshot to the previous one and generates a delta report. A Microsoft Fluent-styled dashboard reads both JSON files and renders the results. An Azure Function proxies requests to the Anthropic API so the AI Copilot can answer questions about the data without exposing keys in the frontend.
Setting Up the App Registration
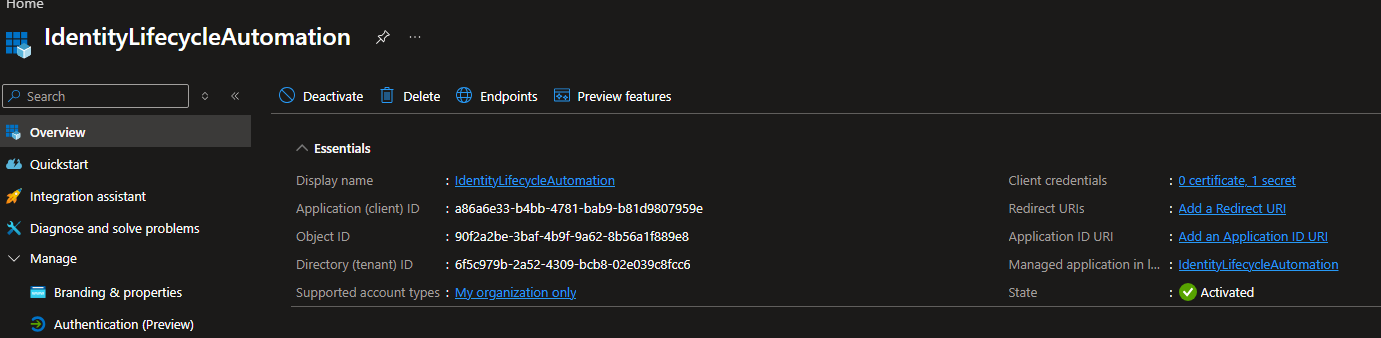
Everything in this project runs through Microsoft Graph with application permissions, meaning the script authenticates as itself rather than as a user. That required an app registration in Entra ID with the right permissions granted at the tenant level.
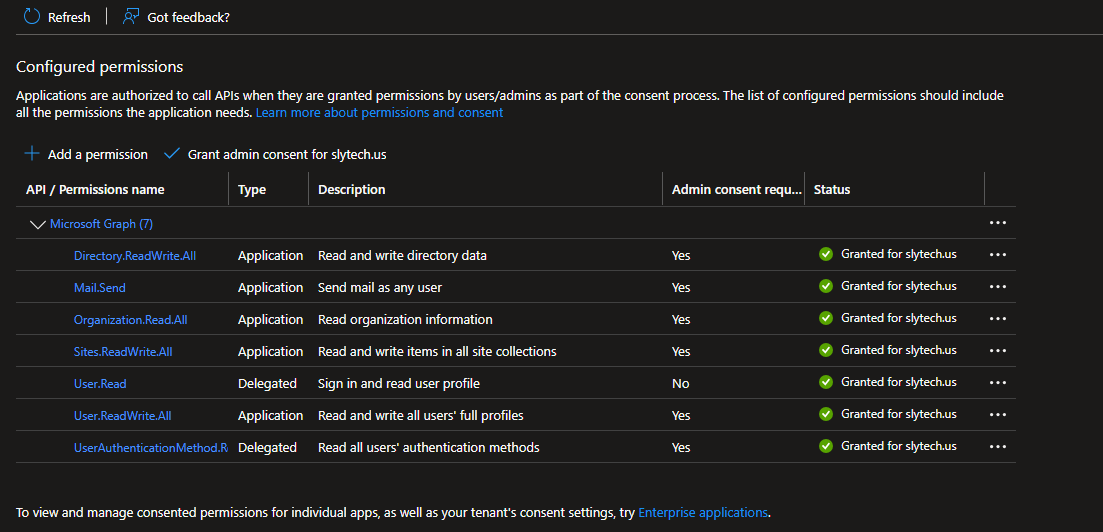
The app registration went in under the name identity-governance-portal. Five permissions covered everything needed for the MVP.
The permissions that tripped me up were the MFA-related ones. The credentialUserRegistrationDetails endpoint I initially targeted returned a 400. The replacement endpoint, authenticationMethods/userRegistrationDetails, returned a 403. Both require either Entra ID P1/P2 licensing or a specific permission scope that my personal M365 tenant did not have. I cut MFA from the MVP scope and documented the licensing requirement. That is an honest note rather than a gap I try to hide.
The one step that is easy to miss on app registrations is admin consent. Adding the permissions is not enough. Every permission needs the green checkmark under Status on the API permissions page, which only appears after an admin explicitly grants consent. Without that step the token acquires fine but every Graph call returns 401.
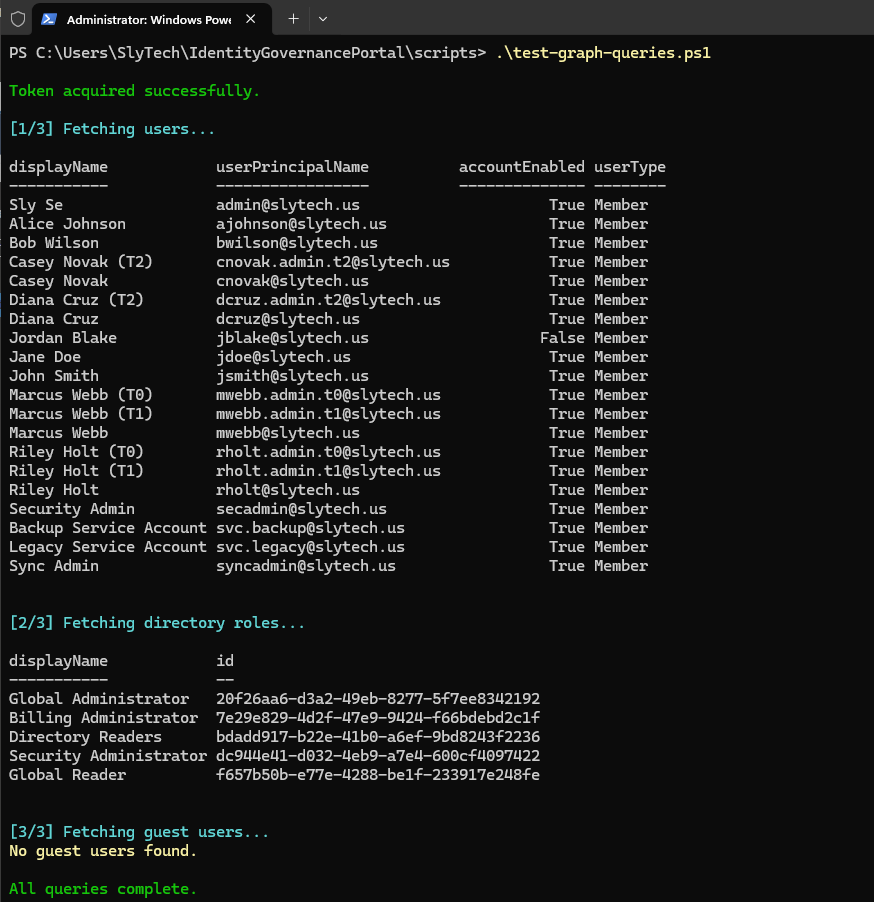
Validating the Graph Queries First
Before writing a single line of the snapshot collector, I wrote a validation script that tested each Graph endpoint in isolation. This was the right call. Graph API documentation describes what endpoints return. What they actually return on your specific tenant with your specific licensing tier is a different conversation.
# Load credentials from .env
$envVars = Get-Content ..\.env | ConvertFrom-StringData
$tenantId     = $envVars.TENANT_ID
$clientId     = $envVars.CLIENT_ID
$clientSecret = $envVars.CLIENT_SECRET

# Get access token
$body = @{
    grant_type    = "client_credentials"
    client_id     = $clientId
    client_secret = $clientSecret
    scope         = "https://graph.microsoft.com/.default"
}

$tokenResponse = Invoke-RestMethod `
    -Uri "https://login.microsoftonline.com/$tenantId/oauth2/v2.0/token" `
    -Method POST `
    -Body $body

$token   = $tokenResponse.access_token
$headers = @{ Authorization = "Bearer $token" }
Three of the five planned queries worked cleanly on the first run. Users with account status, directory role assignments, and guest account filtering all returned good data. The MFA and sign-in activity endpoints hit the licensing wall and got cut. Knowing that before designing the JSON schema meant the schema reflected reality rather than aspirational API coverage.
The Snapshot Collector
The snapshot collector runs as a standalone PowerShell script for now, with the intent to move it into an Azure Function timer trigger as a later phase. It pulls users, directory roles with their members, and guest accounts, then calculates a governance score and generates observations before writing the whole thing as a versioned JSON file.
The governance score formula is simple on purpose. Start at 100. Subtract 10 if any disabled accounts exist. Subtract 10 if guest accounts exceed five. Subtract 20 if privileged user count exceeds two. Subtract 10 for each disabled user still holding an active license. The score is not meant to be a precise security metric. It is meant to move visibly when something changes and give the dashboard a headline number that a non-technical stakeholder can interpret at a glance.
The JSON schema versioning came from a practical need. The drift engine needs to compare two snapshots reliably. Storing them as snapshots/YYYY-MM-DD/identity-snapshot.json meant the comparison logic could always sort by filename, take the two most recent, and diff them without any additional metadata.
$snapshot = @{
    snapshotMetadata = @{
        snapshotDate    = $snapshotDate
        snapshotVersion = "1.1"
        tenantId        = $tenantId
        tenantDomain    = "slytech.us"
        collectedBy     = "IdentityGovernancePortal"
    }
    summary = @{
        totalUsers       = $allUsers.Count
        activeUsers      = $activeUsers.Count
        disabledUsers    = $disabledUsers.Count
        guestUsers       = $guestUsers.Count
        privilegedUsers  = $uniquePrivilegedCount
        governanceScore  = $score
    }
    users = @($allUsers | ForEach-Object {
        @{
            id                = $_.id
            displayName       = $_.displayName
            userPrincipalName = $_.userPrincipalName
            accountEnabled    = $_.accountEnabled
            userType          = $_.userType
            createdDateTime   = $_.createdDateTime
            department        = $_.department
            hasLicense        = $_.assignedLicenses.Count -gt 0
        }
    })
    directoryRoles         = $directoryRoles
    governanceObservations = $observations
}
Running it against the slytech.us tenant came back clean: 21 users, 19 active, 2 disabled, 0 guests, 2 privileged, governance score of 90.
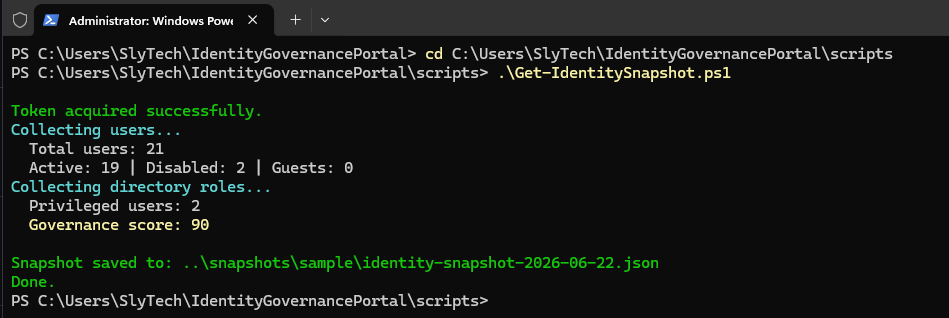
One thing that showed up immediately in the output was tuser@slytech.us flagged as a disabled account. That is the test user from the identity lifecycle automation project. The governance layer did not know that. It just saw a disabled account sitting in the tenant and flagged it. That is exactly the behavior the system is supposed to have.
The Drift Detection Engine
The drift engine is where the project gets interesting. Comparing two weekly snapshots produces the kind of output that security teams actually look at during access reviews: what changed, who was added, who got disabled, did any privileged role assignments change.
The comparison logic loads the two most recent snapshot files, diffs the user arrays by UPN, checks which accounts flipped from enabled to disabled, compares directory role memberships, and generates observations with severity levels.
$snapshotFiles = Get-ChildItem -Path $snapshotsPath -Filter "identity-snapshot-*.json" |
    Sort-Object Name -Descending

$current  = Get-Content $snapshotFiles[0].FullName | ConvertFrom-Json
$previous = Get-Content $snapshotFiles[1].FullName | ConvertFrom-Json

$newUsers     = $currentUPNs  | Where-Object { $_ -notin $previousUPNs }
$removedUsers = $previousUPNs | Where-Object { $_ -notin $currentUPNs }

$newlyDisabled  = $currentDisabled  | Where-Object { $_ -notin $previousDisabled }
$newPrivileged  = $currentPriv      | Where-Object { $_ -notin $previousPriv }
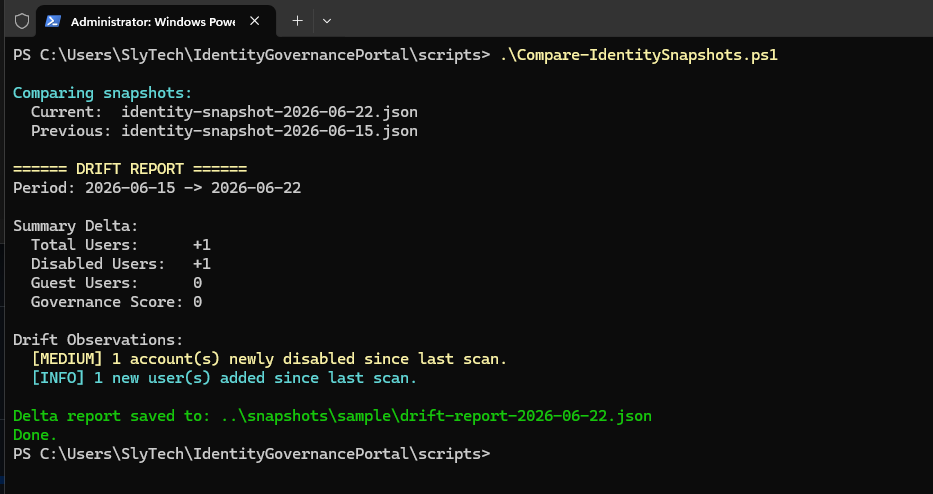
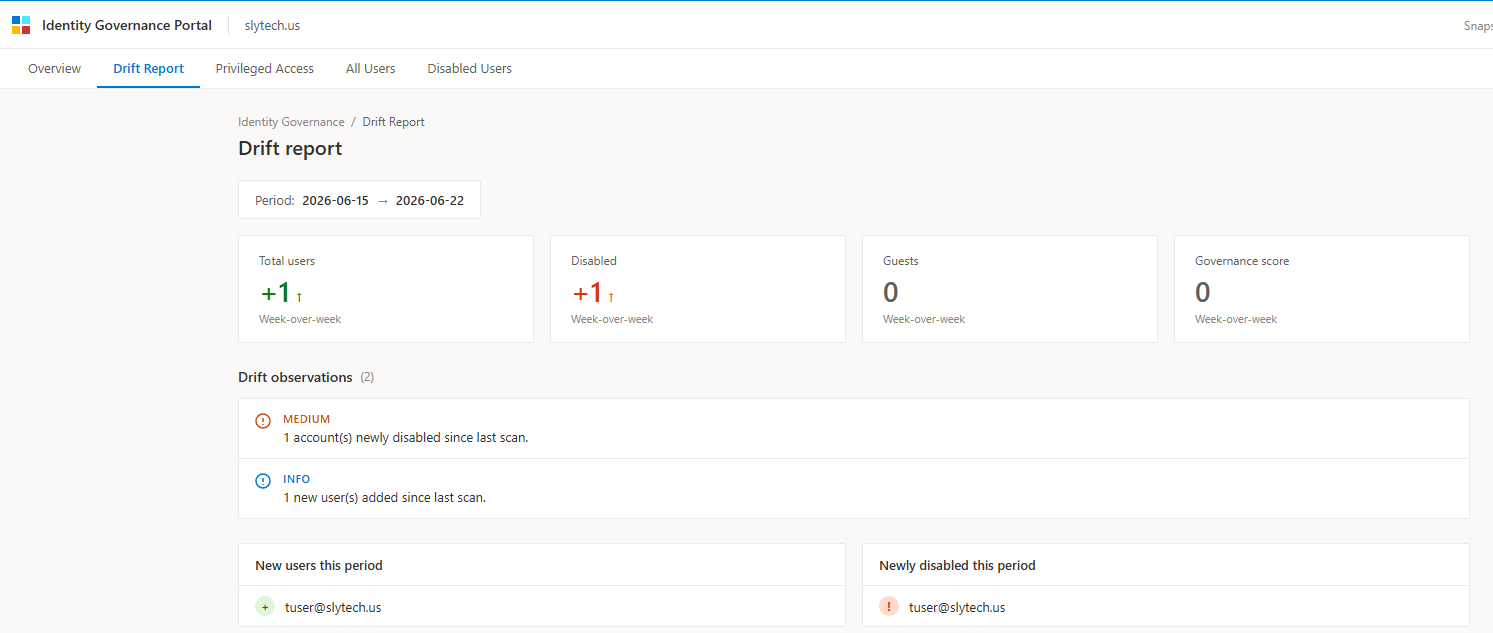
To test it properly I created a simulated previous week snapshot by copying the current one, backdating it to the prior Friday, and removing tuser from the users array with a slightly lower disabled count. The drift engine picked it up correctly: one new user added, one newly disabled account, period 2026-06-15 to 2026-06-22.
One thing to note honestly: a weekly snapshot cadence has a blind spot. If a Global Admin role gets assigned on Monday and removed by Thursday, the Friday snapshot never sees it. That is an acceptable tradeoff for an MVP. In a production implementation you would supplement weekly snapshots with event-driven triggers off Entra ID audit logs. That is on the roadmap.
The Dashboard
The overview page starts with an executive health bar that gives a manager-level read in under ten seconds. Identity health status, governance score, critical findings count, week-over-week user delta, estimated license waste in dollars per month, and the highest risk account. All six cells calculated from live snapshot and drift data.
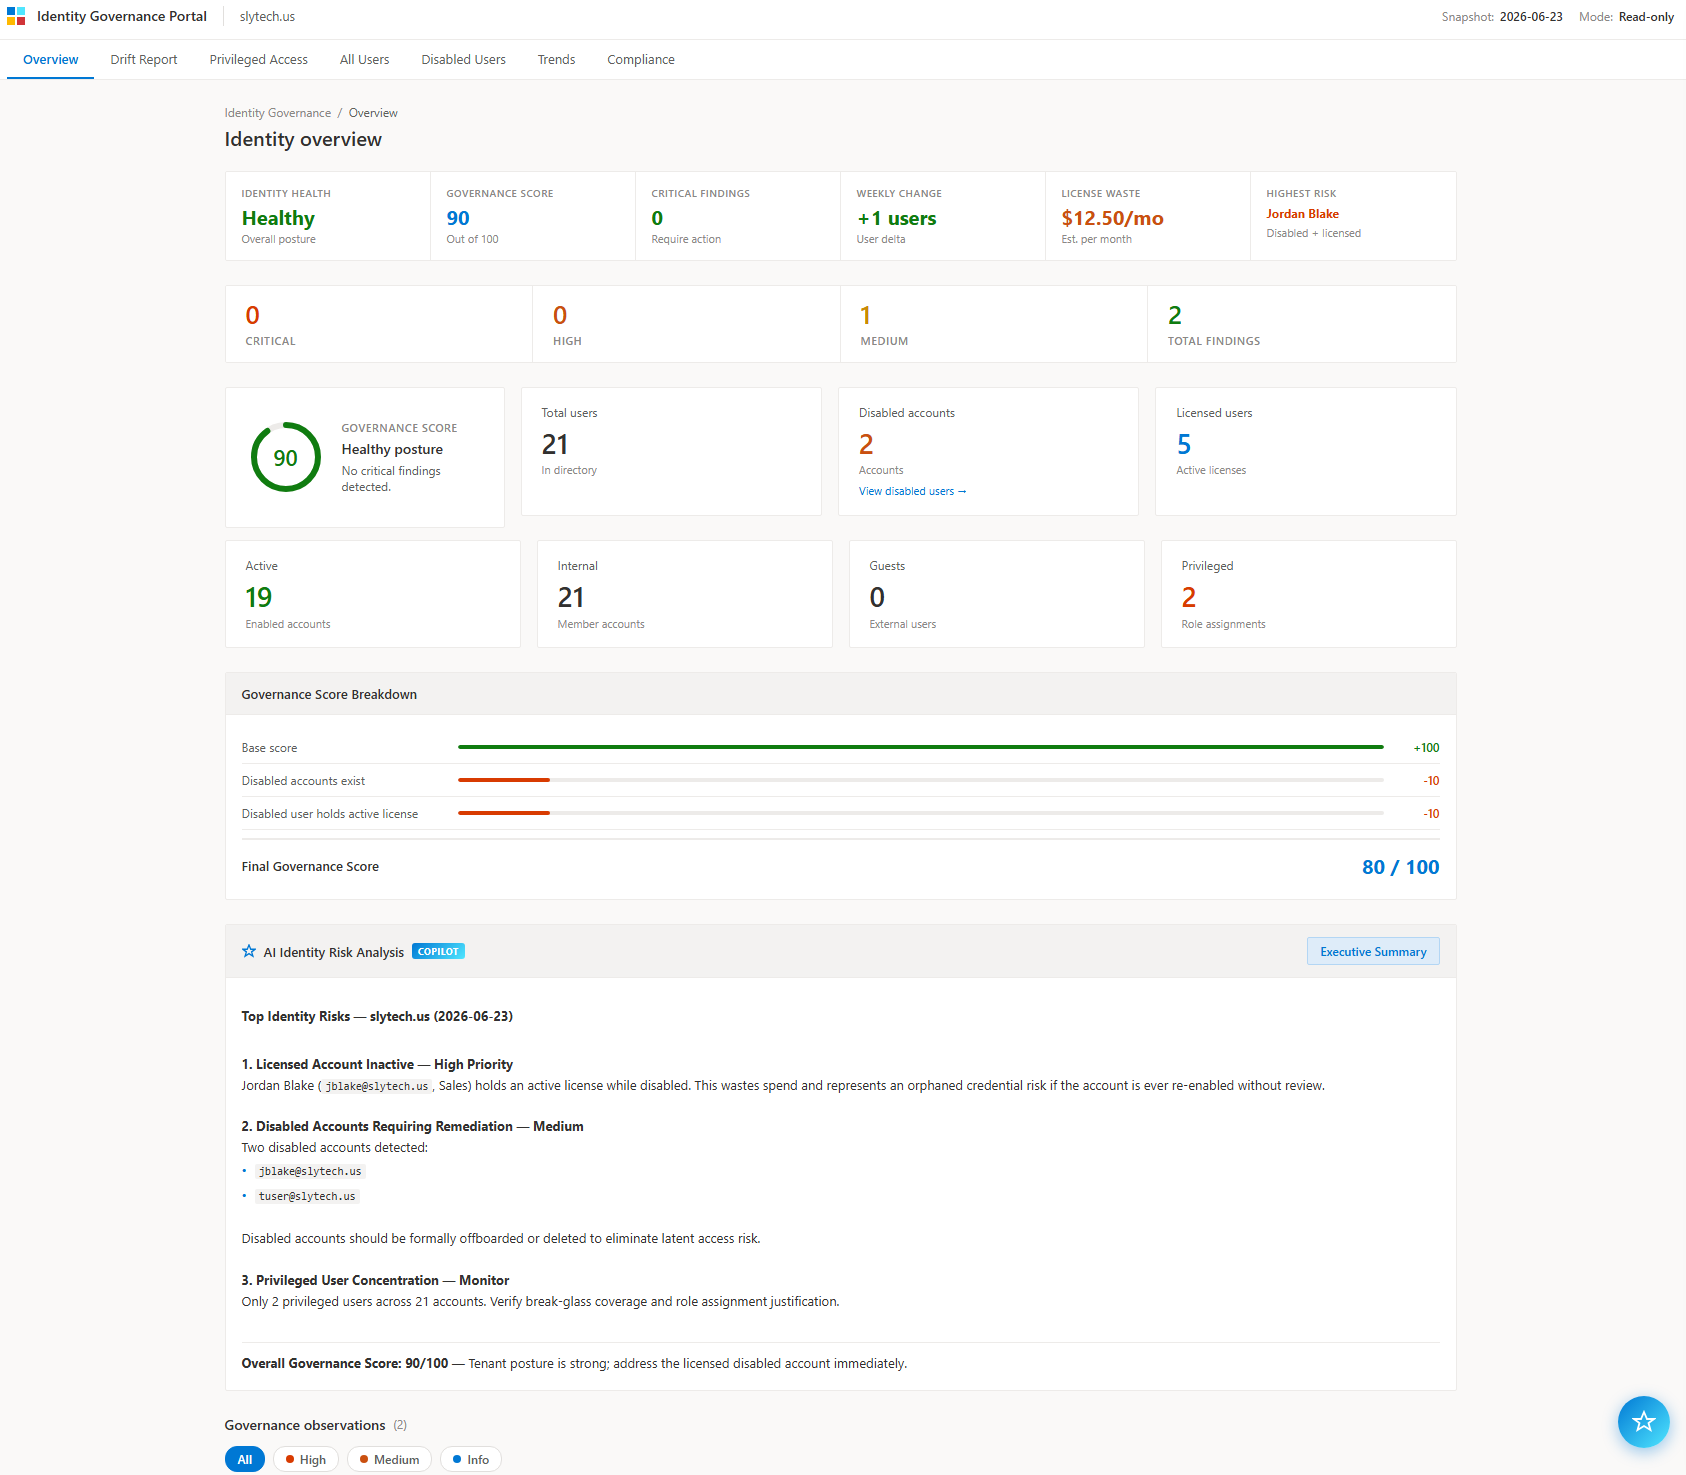
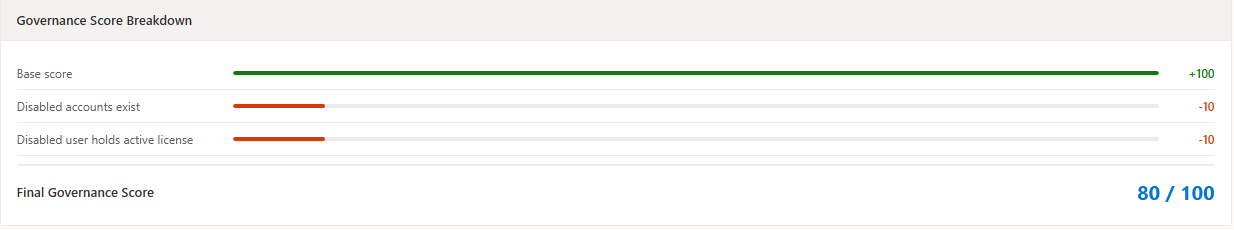
Below the health bar, the governance score breakdown makes the calculation transparent. Every deduction is listed with a visual bar showing its weight. Base score of 100, minus 10 for disabled accounts existing, minus 10 for a disabled user holding a license, final score of 80. Anyone looking at the dashboard can see exactly why the score is what it is, which is more useful than a number with no explanation.
The observations are clickable. Clicking any finding opens a detail panel with the risk level, why it is a risk, which accounts are affected, the business impact, recommended remediation steps, and the Microsoft best practice reference. It reads like what a security analyst would put in a findings report.
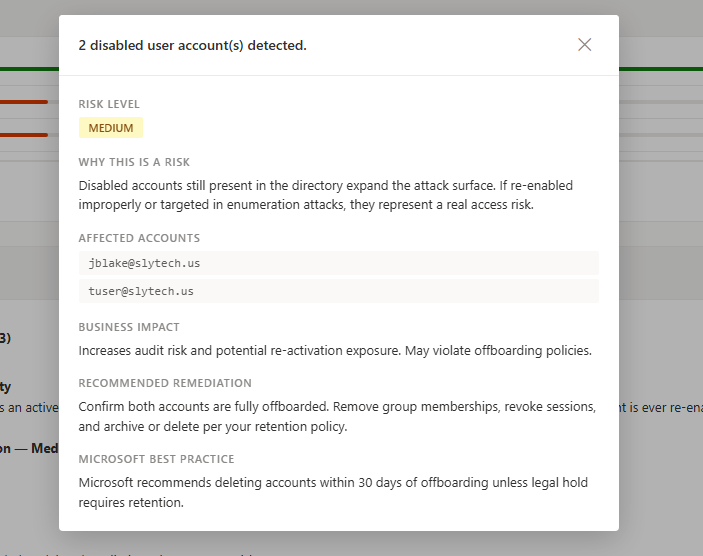
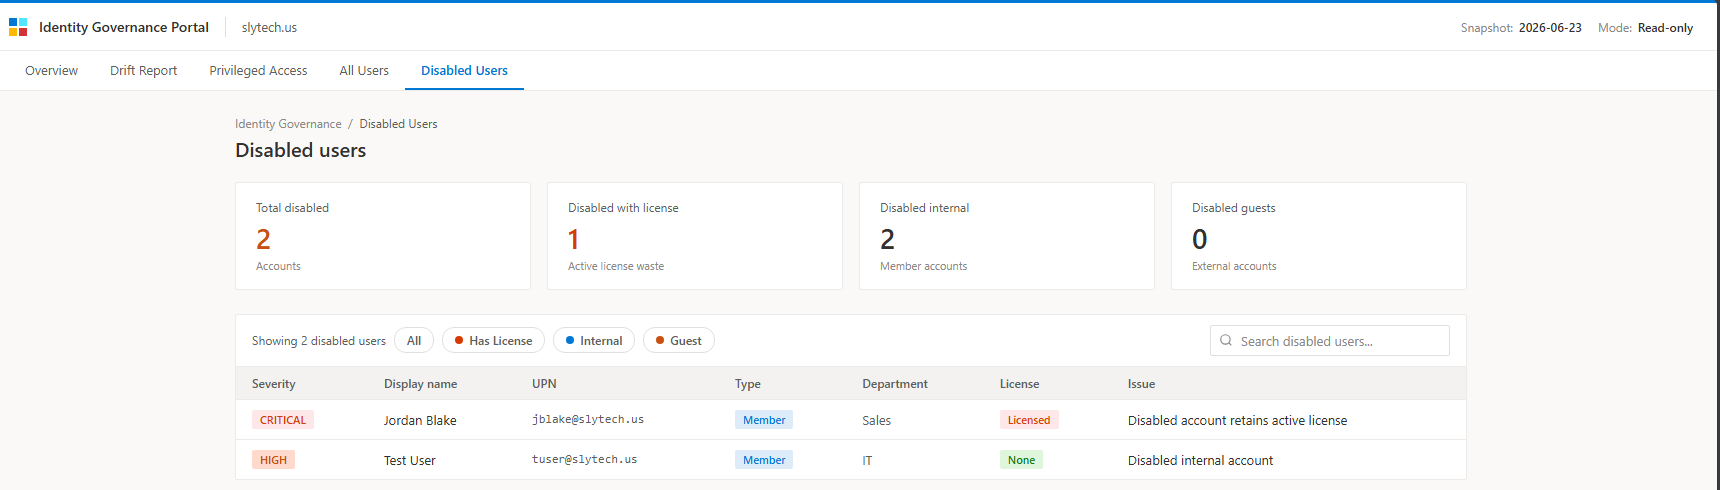
The disabled users page ended up being the most useful addition. It ranks every disabled account by severity: Critical if the account still holds an active license, High if it is a disabled internal account, Medium otherwise. Jordan Blake showing as CRITICAL is a real finding in the slytech.us tenant. Disabled account, Sales department, still licensed. In a real environment that is a wasted license and a potential access risk if the account ever gets re-enabled without a full access review.
The drift report page renders the week-over-week deltas with color-coded arrows. Green for improvements, red for regressions.
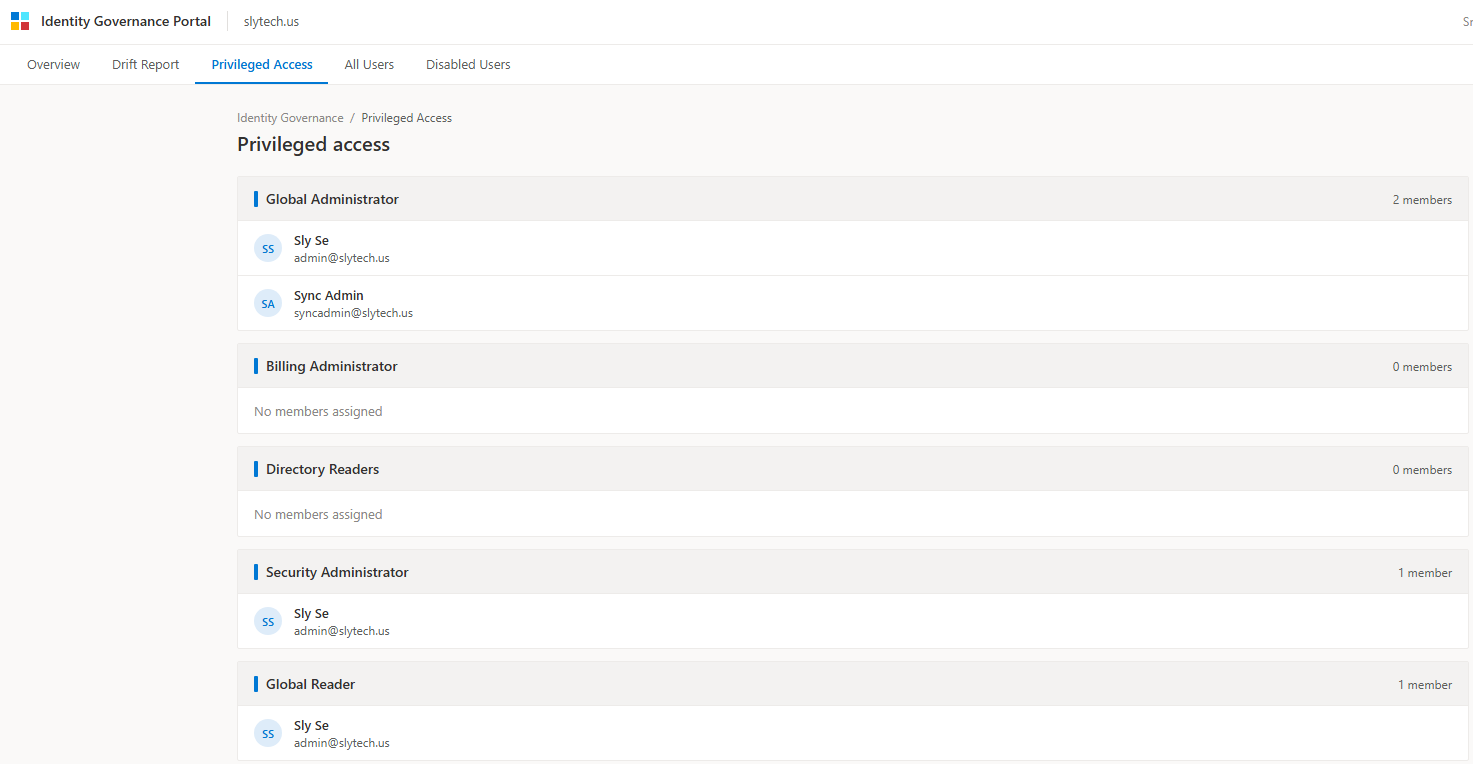
The privileged access page lists every directory role with its current members. Global Administrator shows two members on this tenant: the primary admin account and a Sync Admin service account that got assigned during Entra Connect setup. That second assignment is the kind of thing that lives in a tenant for months before anyone notices it during an audit.
The Compliance Page
After building the dashboard I added a compliance page that maps the snapshot data to real framework controls. Six controls total: MFA Coverage, Disabled Account Cleanup, License Hygiene, Guest Account Governance, Privileged Account Review, and Global Admin Count. Each one shows pass, fail, review, or data unavailable, calculated from the live snapshot data, not hardcoded.
Each control maps to CIS Controls, NIST CSF, ISO 27001, and Microsoft Secure Score references. The finding description explains what the snapshot shows and the remediation section tells you what to do about it.
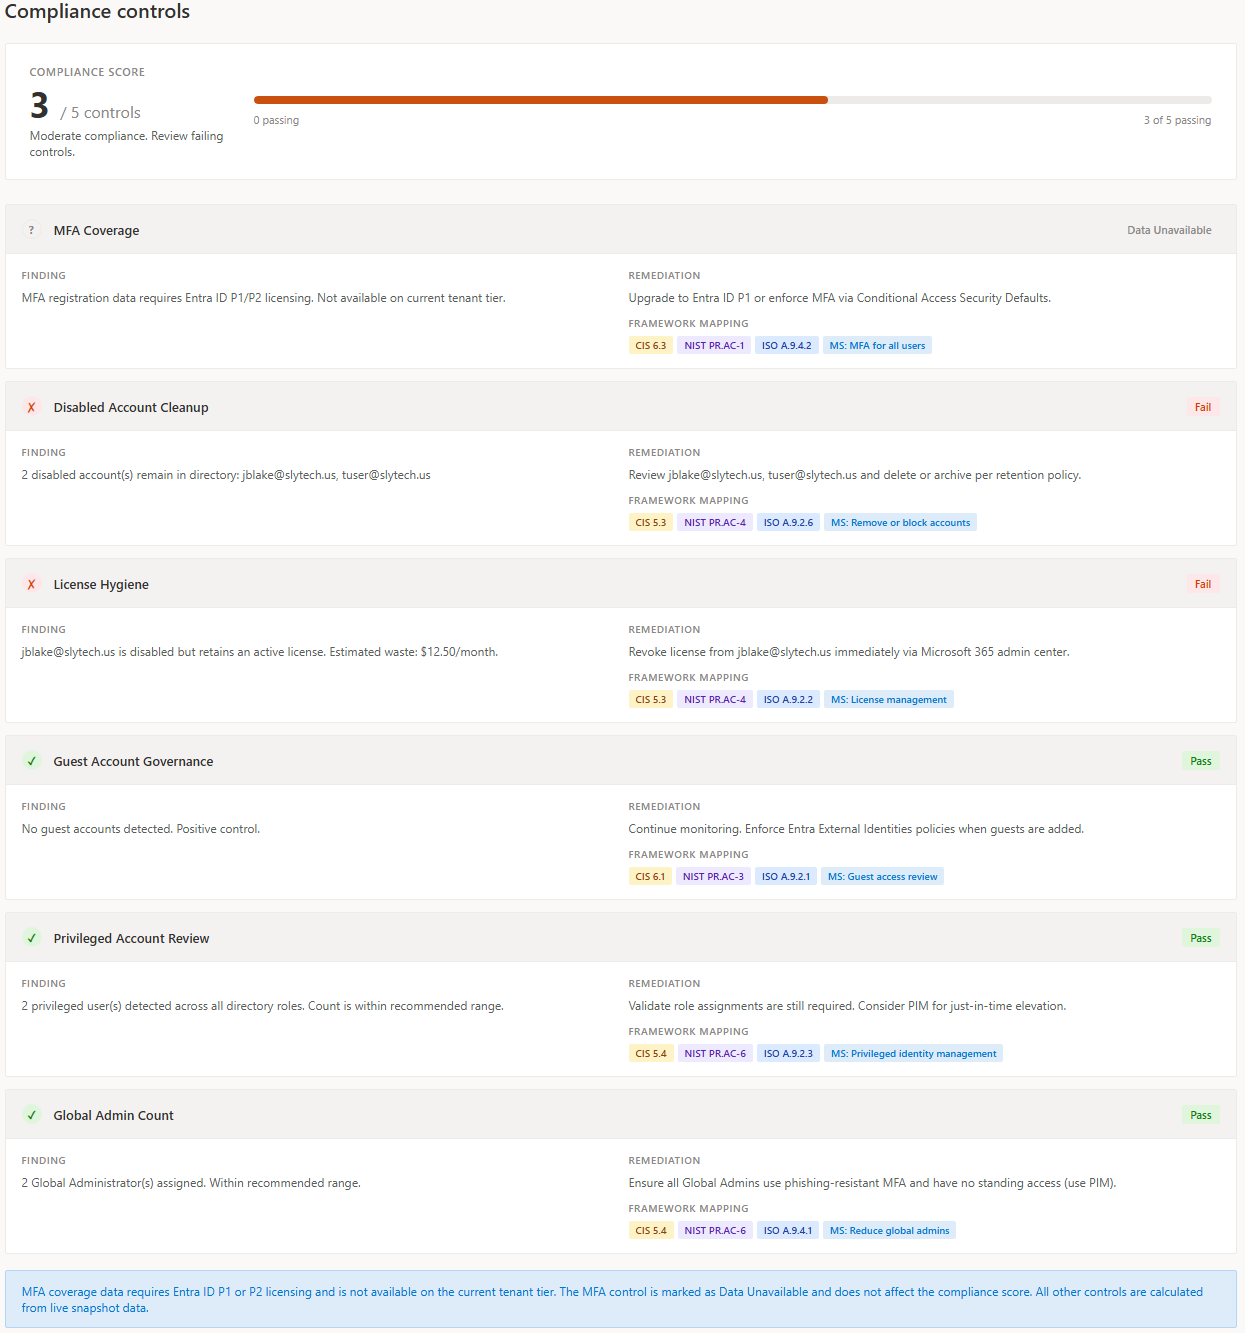
Jordan Blake’s license issue shows as a failing control on License Hygiene automatically. The control knows a disabled user has a license because it reads from the same snapshot the rest of the dashboard uses. Change the underlying data, the control status changes. That is the behavior you want from a governance system.
MFA Coverage shows as Data Unavailable with a note about Entra ID P1 licensing. That is an honest representation of what the current tenant tier can provide, not a gap I tried to paper over.
Adding an AI Copilot
The final phase turned the portal into something genuinely different: a governance system that explains itself. I added an AI Copilot powered by Claude that reads the snapshot and drift data and answers natural language questions about what it finds.
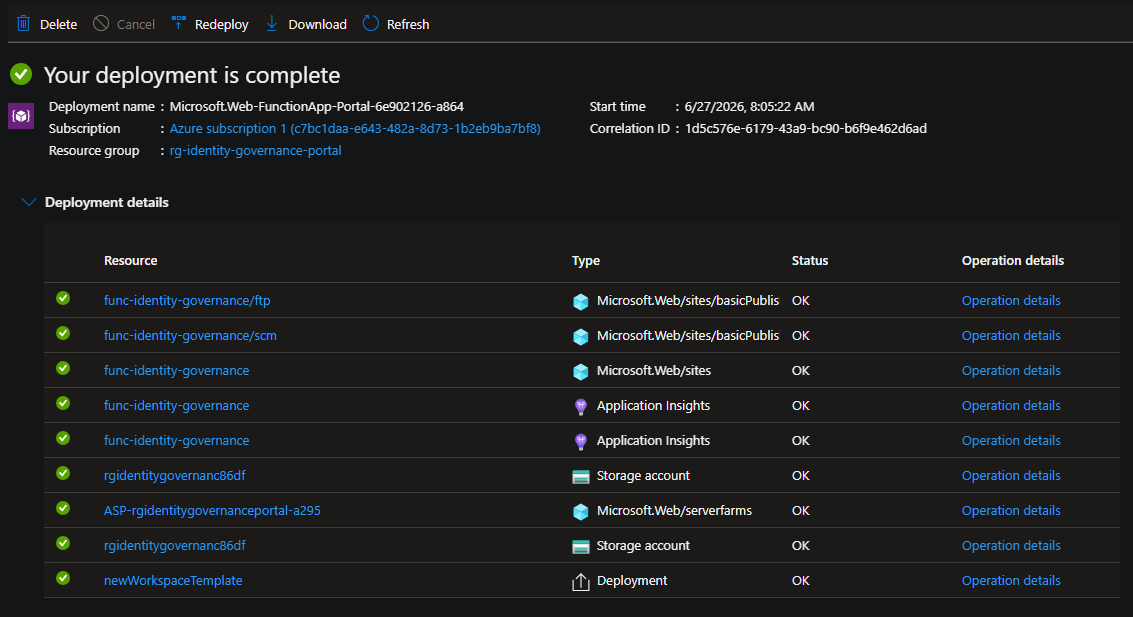
The architecture uses an Azure Function as a proxy. The browser sends requests to the Function, the Function adds the API key from Azure App Settings and forwards to the Anthropic API, and the response comes back. The API key never touches the frontend.
The Copilot is context-aware. When you are on the Disabled Users page and ask “what is the risk here?”, it automatically receives the disabled user data as context. When you are on the Drift Report and ask “explain these changes”, it receives the drift report. You never paste data into the chat manually.
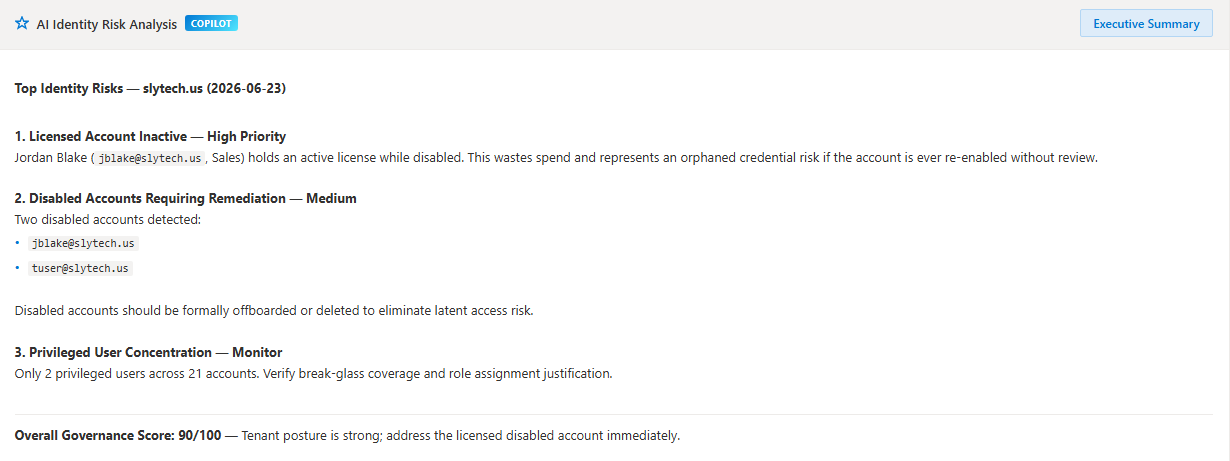
The AI Risk Analysis card on the Overview page loads automatically and generates a plain English summary of the most important findings from the snapshot. The first time I ran it, it flagged Jordan Blake by name, called out the licensed disabled account as the most pressing finding, and noted that the tuser account suggested incomplete test account lifecycle governance. It read those findings from the JSON. It did not guess.
The Executive Summary button generates a compact governance digest in under 40 words. Score, key facts, one action item. The kind of thing you would send to a manager before a weekly review.
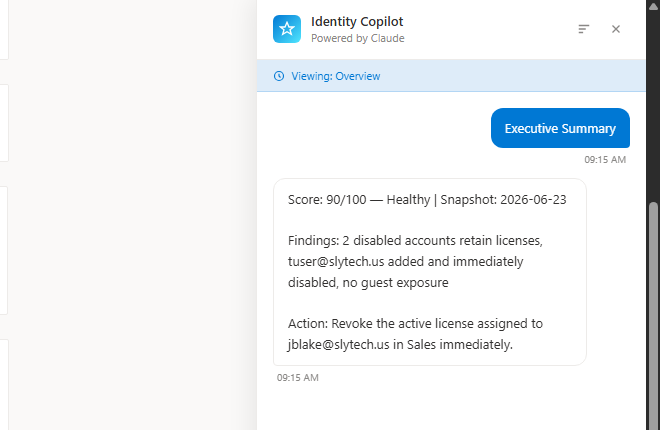
The Copilot panel itself stays open alongside the dashboard. You can ask follow-up questions, switch pages, and the context updates automatically. The suggested prompts change based on which page you are viewing.
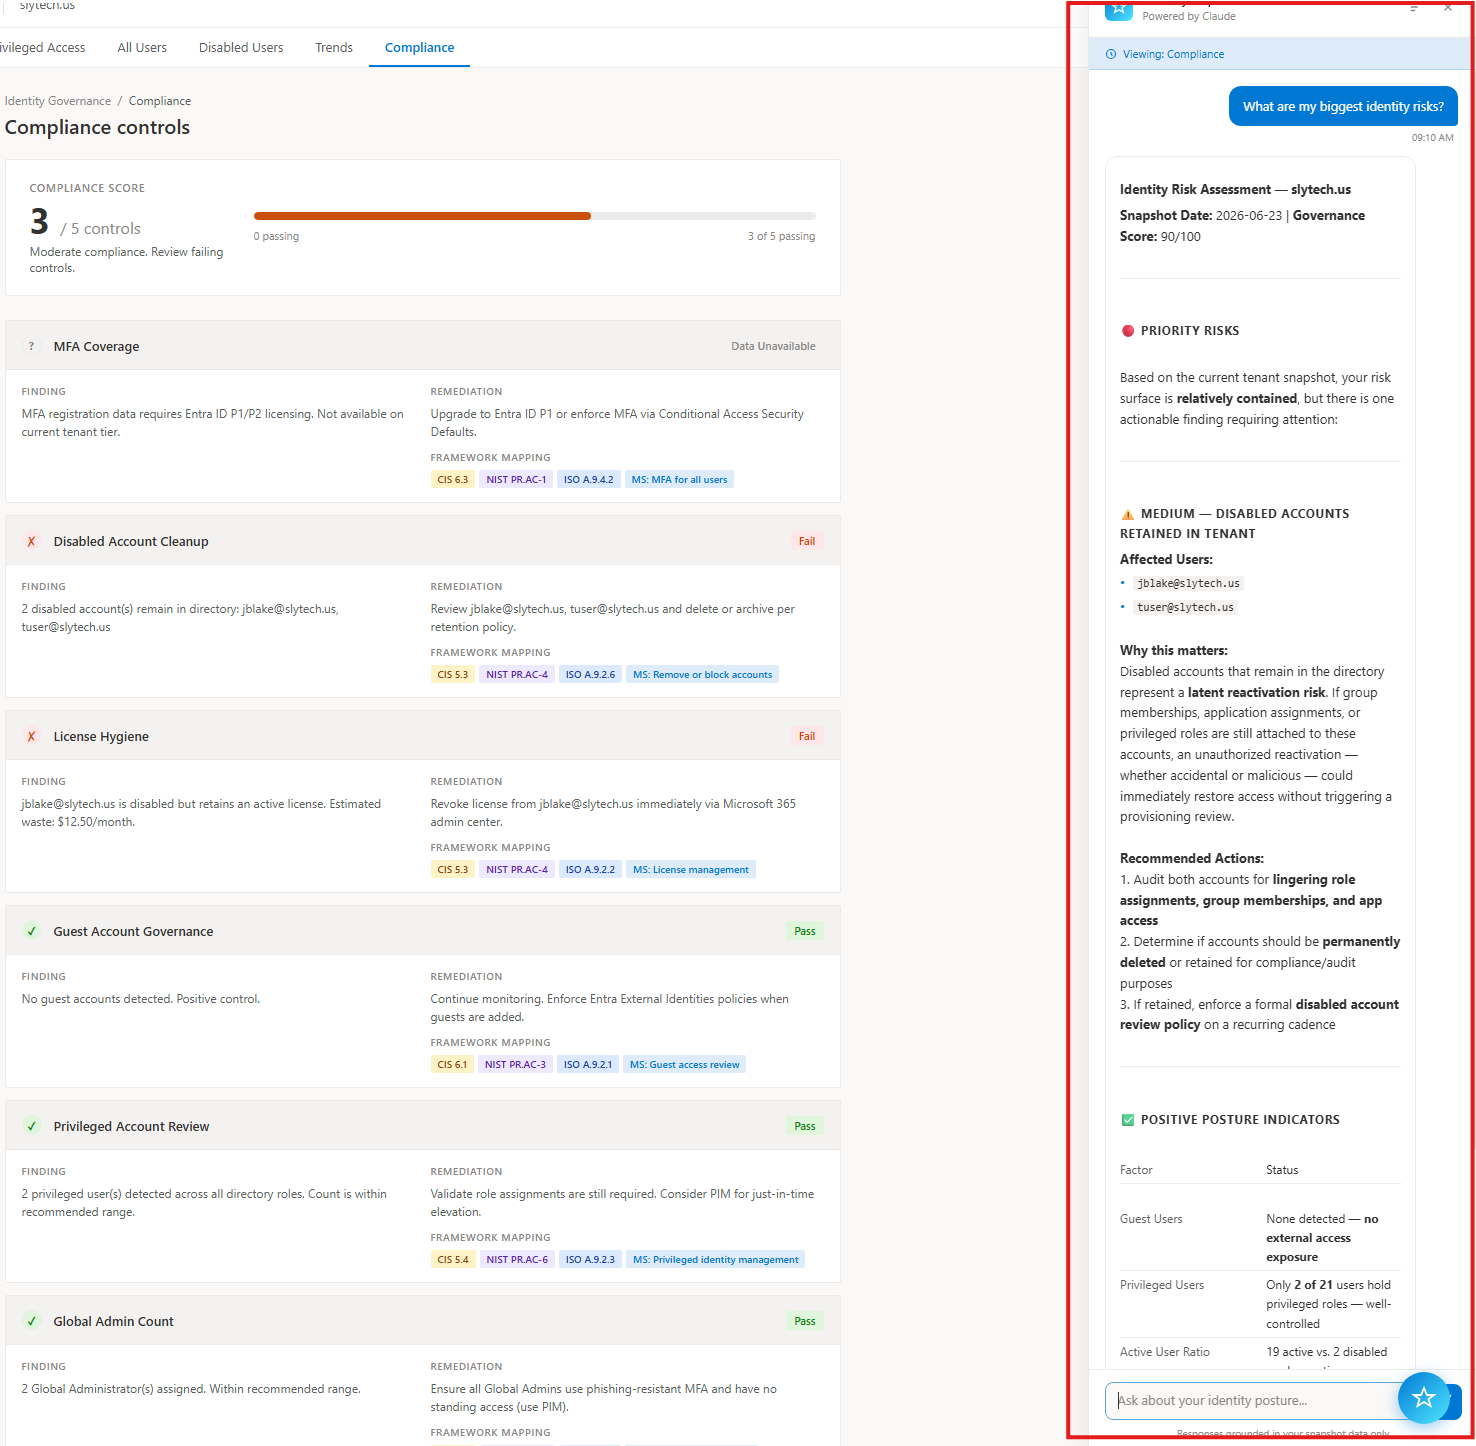
The model behavior is strict. The system prompt instructs it to stay grounded in the provided context, never hallucinate tenant state, and treat missing fields as unknown rather than implied. The responses reference actual user names and UPNs from the snapshot, not generic advice. That distinction matters. Generic AI advice about identity governance is easy to find. An analyst that reads your specific tenant data and explains what it found is something different.
Wrapping Up
Building the automation first, then the visibility layer, then the AI layer turned out to be the right order. Each phase found things the previous one could not. The automation handled provisioning. The governance portal found a disabled account holding a license, a leftover test user, and a service account in a privileged role that should not be there permanently. The AI Copilot explained why those findings matter and what to do about them.
The project is still local. The Azure Function is deployed but the snapshots still live on disk and the dashboard still runs via npx serve. The next phase is deploying to Azure Static Web Apps with Blob Storage for the snapshots and a timer-triggered Function for automated weekly collection. That is when it stops being a portfolio project and starts being a running governance system. The full source, scripts, and snapshots are on GitHub.